NGS Tools
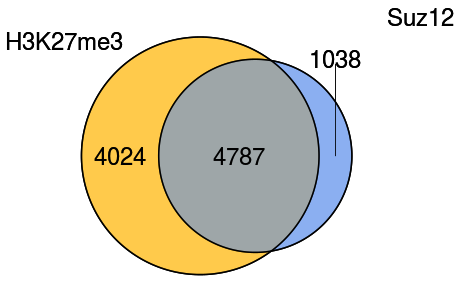
Compare2Peaks
This is a web server to compare two lists of peaks/regions and produce a Venn Diagram. The peaks in common and those belonging to each list specifically are separated into different resulting files.
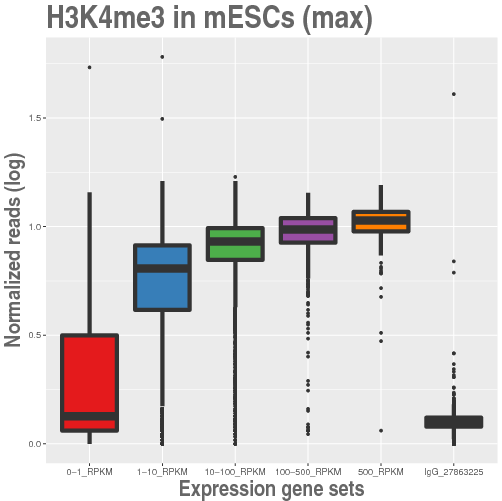
ComputeChIPlevels
This is a web server to determine the strength of the ChIPseq signal of selected experiments from the literature in a set of multiple lists of genes. The ChIP levels are graphically shown in boxplots of normalized reads.
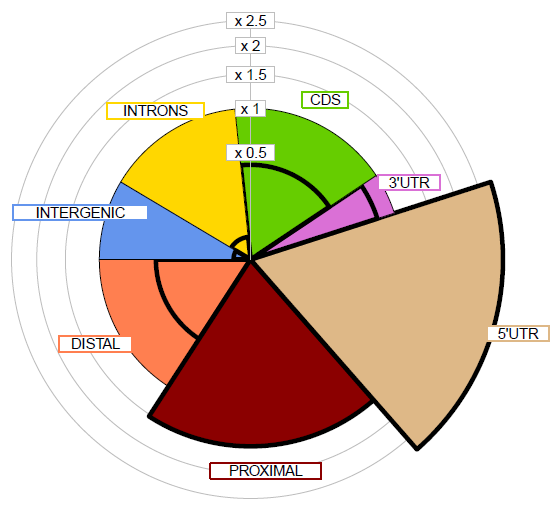
PeakAnnotator
This is a web application to annotate one set of regions in BED format: (a) Generating the genome distribution piechart of gene features and (b) Matching the peaks to target genes using a set of association rules.
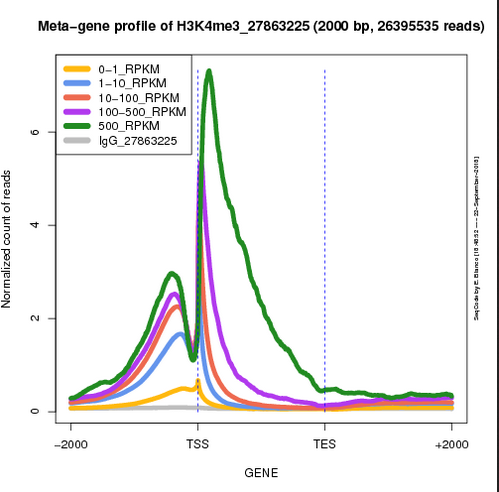
ProduceGENEplots
This is a web application to generate the meta-gene profile of the ChIPseq signal along a gene model of selected genes. The user can choose from a selection of published experiments and configure the graphical parameters of the resulting plot.
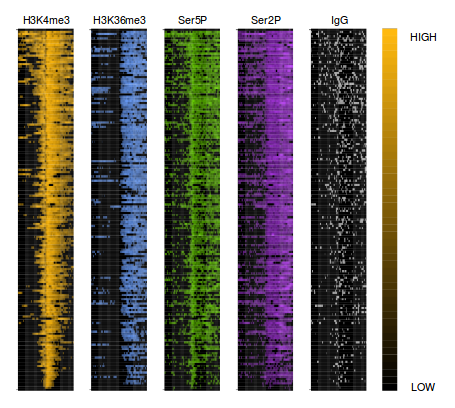
ProduceTSSmaps
This is a web application to generate the heat map of the ChIPseq signal around the TSS of a subset of selected genes. The user can choose from a selection of published experiments and configure the graphical parameters of the resulting plot.
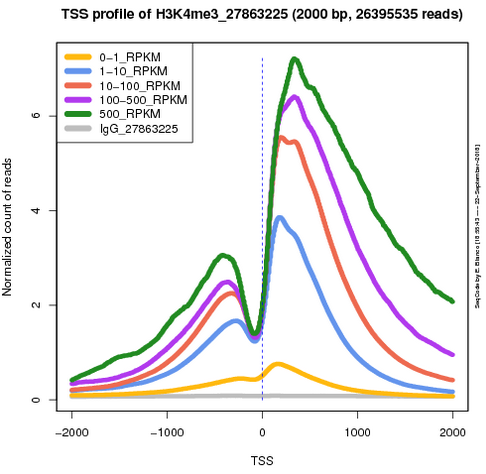
ProduceTSSplots
This is a web application to generate the average profile of the ChIPseq signal around the TSS of a subset of selected genes. The user can choose from a selection of published experiments and configure the graphical parameters of the resulting plot.