Data Sets
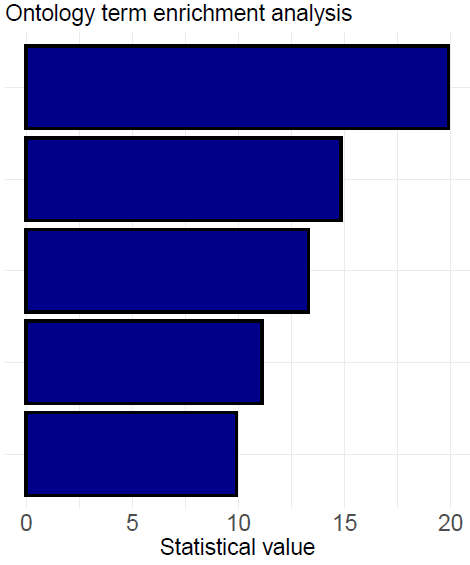
BarPlotter
This web server generates barplots from ontology term enrichment analysis. Terms, statistical values and overlaps in comparison to the whole genome can be provided manually by the user or Enrichr tabular files can be directly uploaded to select the scoring attribute that will be used to rank the information.
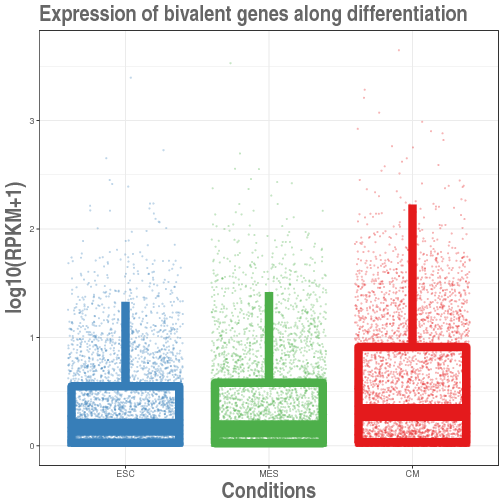
BoxPlotter3
This web server generates box plots and violin plots, allowing to include the observations as points. Multiple palettes of colors and graphical parameters are configurable by the user to define the style of boxes and lines.
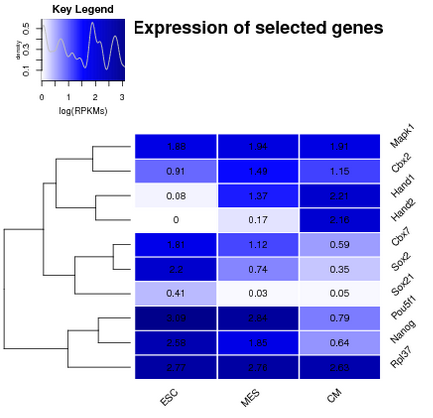
HeatMapper
This is a web service to produce heat maps from values for a subset of elements along a group of conditions. Users can configure the color palette and decide whether or not to perform clustering of rows or columns.
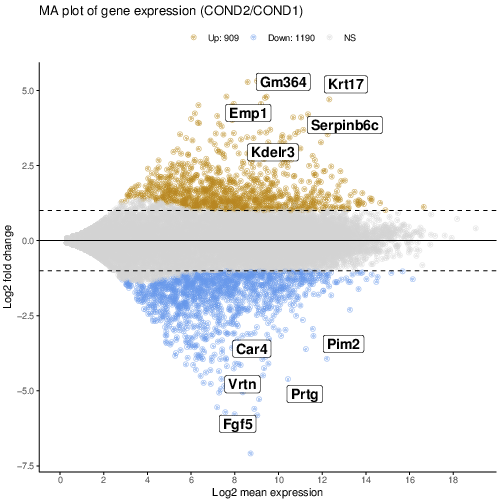
MAPlotter
This is a tool to generate MAplots from differential gene expression analysis files, which allows user to customize all graphical aspects of the resulting image (labels, points, colors, highlighting elements, etc.).
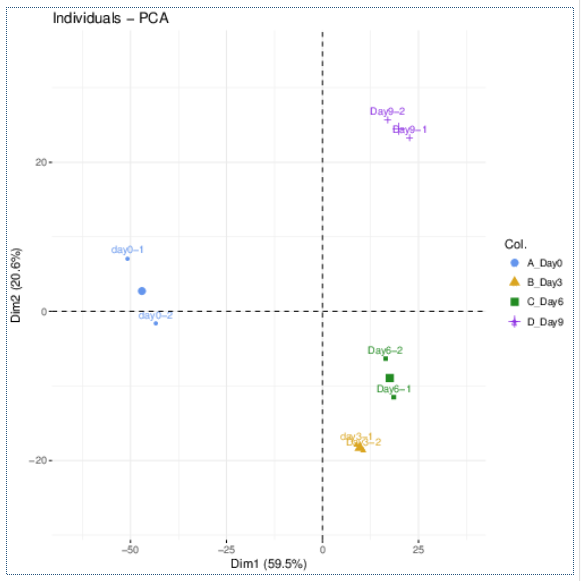
PCAplotter
This web server performs a PCA analysis of a set of distributions (e.g. RNAseq expression, ChIPseq levels, ATACseq signals) to show how these experiments are distributed in the space. This plot can be extremely helpful to understand the quality of the samples.
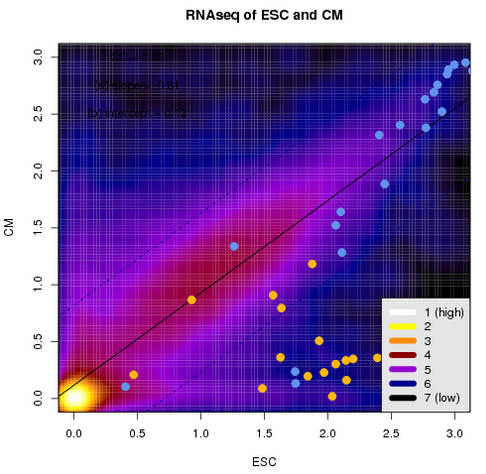
ScatterPlotter
This web server generates scatterplots to show the correlation between two distributions of values for any given list of elements (e.g. genes and gene expression values in RPKMs for two conditions or ChIPseq/ATACseq levels).
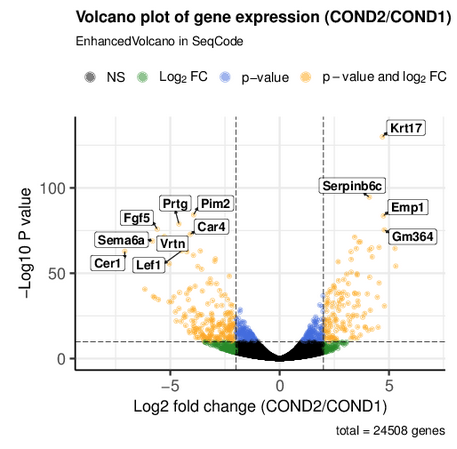
VolcanoPlotter
This web server acts as an interface to the R package EnhancedVolcano in order to generate volcano plots. Practically all graphical parameters and labels (as well as the class of input file) is highly customizable.