What is SeqCode?
Description
SeqCode is a family of applications designed to develop high-quality pictures and perform genome-wide calculations
from high-throughput sequencing experiments. This software is presented into two distinct modes: web tools
and command line. The website of SeqCode offers most functions to users with no previous expertise in bioinformatics,
including operations on a selection of published ChIP-seq samples and applications to generate multiple classes of graphics
from data files of the user. The standalone version of SeqCode, instead, allows bioinformaticians to run each
command on any ChIPseq, ATACseq or RNAseq experiment locally in their computer. The architecture of the source code
is modular and the input/output interface of the commands is suitable to be integrated into existing pipelines of
genome analysis. SeqCode has been written in ANSI C, which favors the compatibility in every UNIX platform and
grants a high performance and speed when analyzing sequencing data. Meta-plots, heatmaps, boxplots and the rest of
images produced by SeqCode are internally generated using R. SeqCode relies on the RefSeq reference annotations
and is able to deal with the genome and assembly release of every organism that is available from this consortium.
The SeqCode web tools are available at: http://ldicrocelab.crg.es
The SeqCode source code is accessible from GitHub at: https://github.com/eblancoga/seqcode
Selection of most relevant SeqCode applications:
The SeqCode web tools are available at: http://ldicrocelab.crg.es
The SeqCode source code is accessible from GitHub at: https://github.com/eblancoga/seqcode
Selection of most relevant SeqCode applications:
- Generate profiles of ChIPseq/ATACseq/RNAseq samples for genome browser visualizations
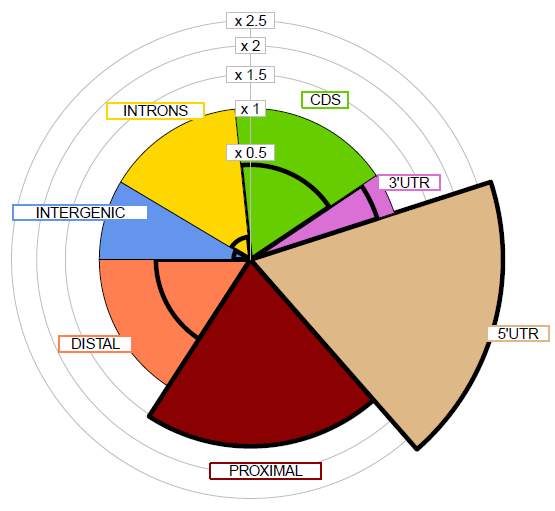
- Calculate the distribution of genome features from a set of ChIP-seq peaks or regions
- Match ChIP-seq peaks to genes based in any catalog of RefSeq transcript annotations
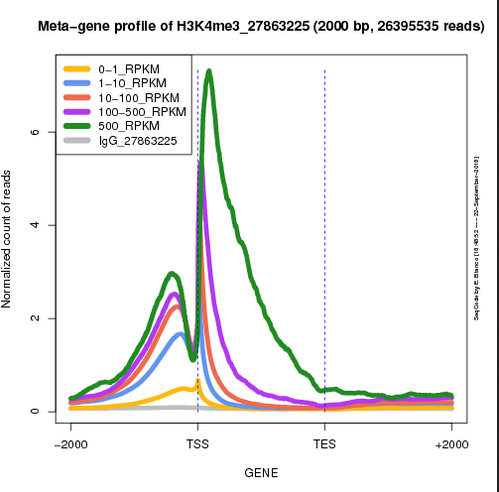
- Produce high-quality aggregated plots centered around TSS, TES, TSS-TES and peak centers
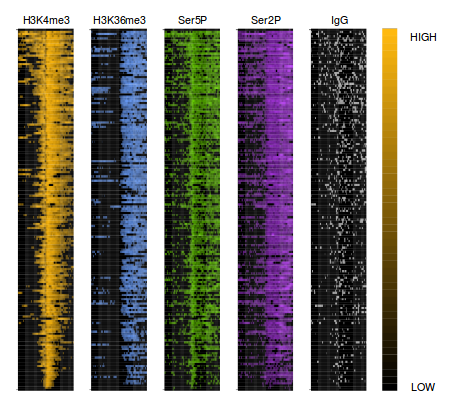
- Produce heat maps of ChIP-seq signal intensities around TSS, TES, TSS-TES and peak centers
- Calculate the count of reads of one sequencing experiment on a set of regions
- Compare two sets of peaks or genomic regions to determine the degree of overlap
- Calculate the evolutionary conservation score on a set of genomic regions
- Introduce spike-in values to normalize most genome-wide analysis
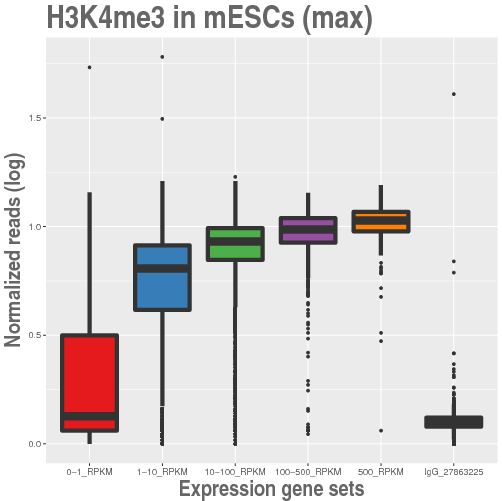
- Generate boxplots with multiple graphical options to customize the final result
- Perform PCA analysis, scatter-plots and heat-maps of genes based on expression or signal values
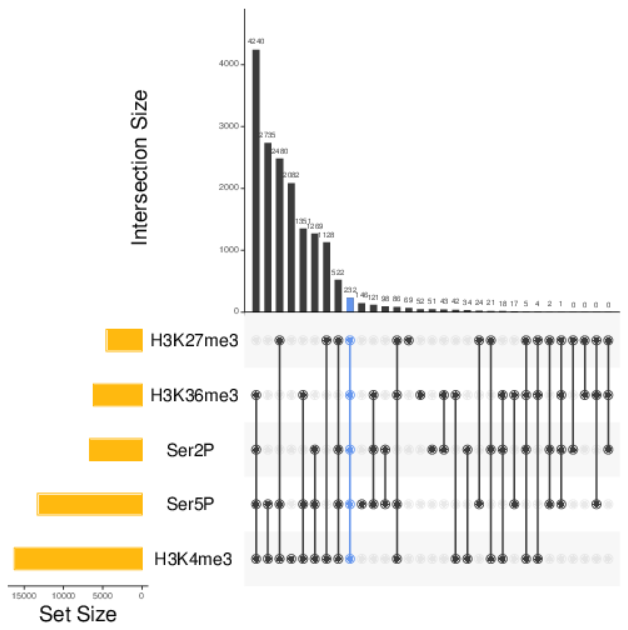
- Produce Venn diagrams for multiple sets of elements and UpSet charts
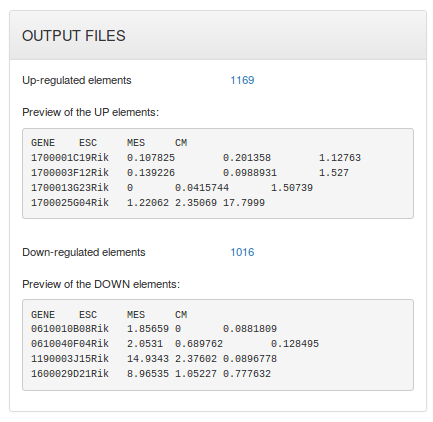
- Basic operations on lists of elements such as join, filter and fold-change analysis
SeqCode Web Tools
The SeqCode website offers multiple applications for the analysis of genomic data. The services are basically
divided into: (i) SeqCode tools for the generation of graphical results from large-scale sequencing samples (NGS tools),
and (ii) general-purpose functions (Data Sets, Gene Sets and List Ops) for the analysis of lists of genes and other
elements that are not part of the command line core distribution.
Please, check the following links for further information on our set of web functions:
Please, check the following links for further information on our set of web functions:
- Tutorials with practical examples preloaded and ready to be executed:
[TUTORIALS] - Glossary of parameters and file formats of each web service:
[FUNCTIONS OPTIONS]
SeqCode Command Line
SeqCode source code entirely written in ANSI C is freely distributed. This software is provided
with a Makefile to generate each application as a separate binary file that runs in UNIX command line
interfaces following the basic standards in terms of interface design and output formats. Most programs
require the user to provide two files for the particular genome that is being analyzed: the list of chromosomes
(and their sizes) and the RefSeq gene transcript annotations. Both files can be easily retrieved for every
particular genome assembly from the UCSC genome browser. Commands working with sequencing data require the user
to provide the mapped reads of the experiment (BAM or SAM format). SeqCode commands offer the verbose option (-v) to
inform on the screen about the basic steps of the procedure. Most commands will generate a new folder containing
the final results of the particular running. By default, this folder will be created in the working directory,
although another path to save the otuput can be defined with the prefix option (-x). Users can customize
most programs using multiple options (please, check the manual of each one with the option -h). Graphical outputs
are produced by running R scripts that will be stored in the resulting folder as well. The command line release
of SeqCode has no limits or restrictions in the set or the size of the input files that will be processed locally
in the computer of the user (differently from the website that is intended to be a teaching resource to show the
distinct modes of showing sequencing information plots).
Please, examine the information on the following links to learn more about:
For further details on how to download SeqCode, check this:
Please, examine the information on the following links to learn more about:
- Details about how to setup the SeqCode applications in your computer:
[SETUP] - Basic description of the SeqCode command line program usage:
[USAGE] - List of SeqCode commands furnished with examples:
[COMMANDS] - Definition of genome data file formats:
[FORMATS]
For further details on how to download SeqCode, check this:
- The SeqCode source code is accessible from GitHub at:
https://github.com/eblancoga/seqcode - Binaries for Linux and Mac OS-X are freely distributed here:
[MAC OS-X] [LINUX] - Virtual machines including a SeqCode preinstallation ready to run:
[VirtualBox] - Docker containers running a SeqCode full distribution:
[DockerContainer]
Gallery of pics
| Genome distribution of peaks | Meta-plot of ChIPseq signals | Heatmap of ChIPseq intensities |
|---|---|---|
 |
 |
 |
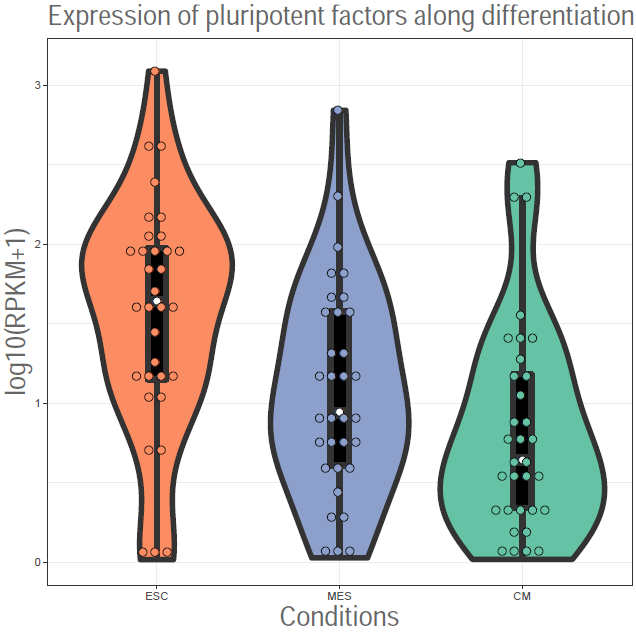
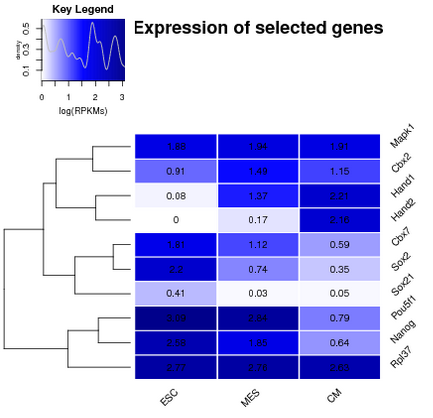
| Boxplot of ChIPseq levels | Boxplot of gene expression | Heatmap of gene expression |
 |
 |
 |
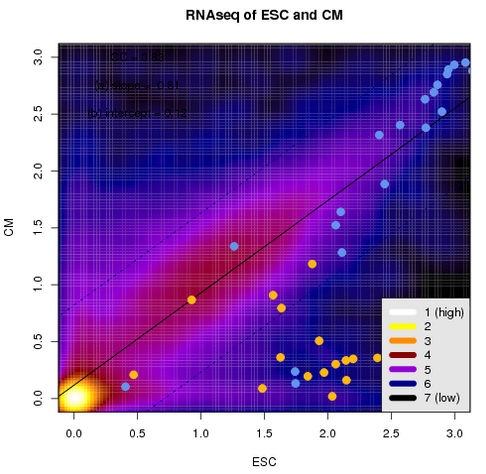
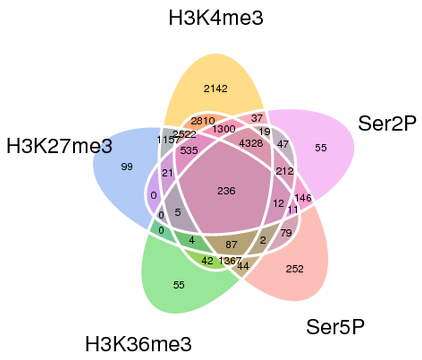
| Scatterplot of expression | Multiple gene comparison | UpSet chart of genes |
 |
 |
 |
| List operations | Combo of maps and plots | |
 |
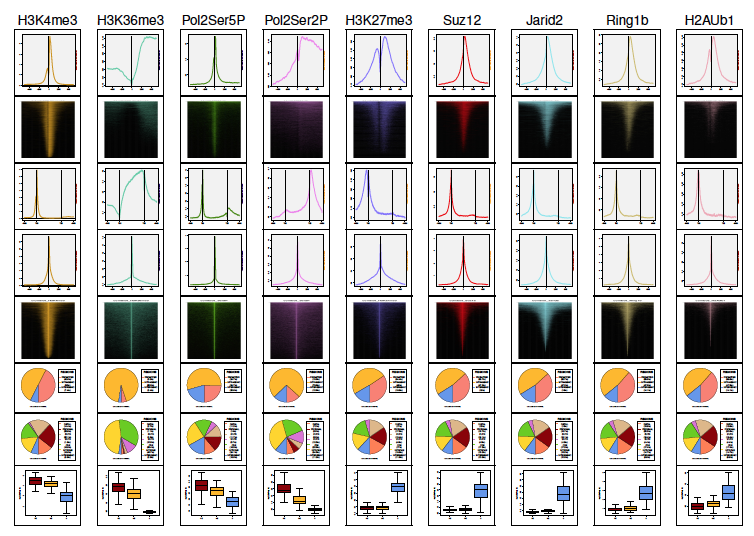 |