Tutorials of SeqCode web tools
NGS Tools
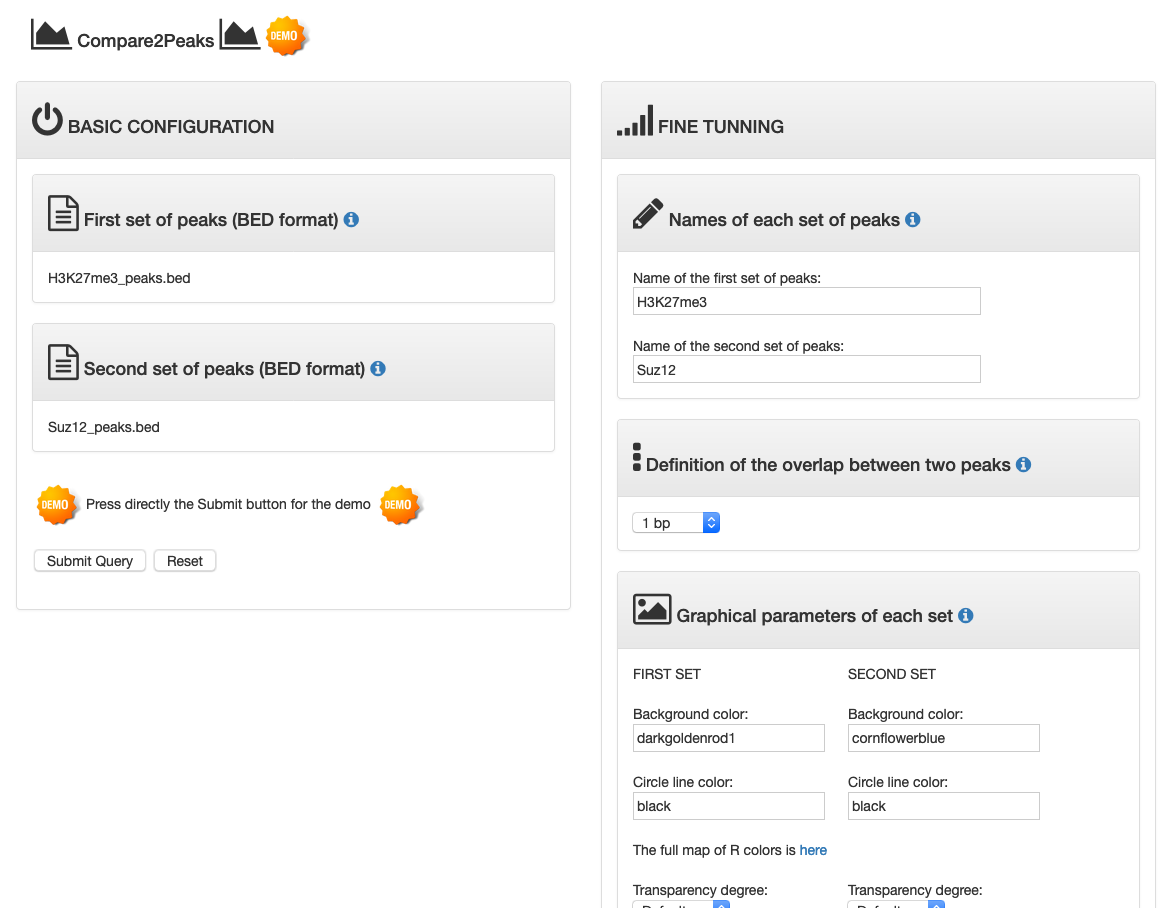
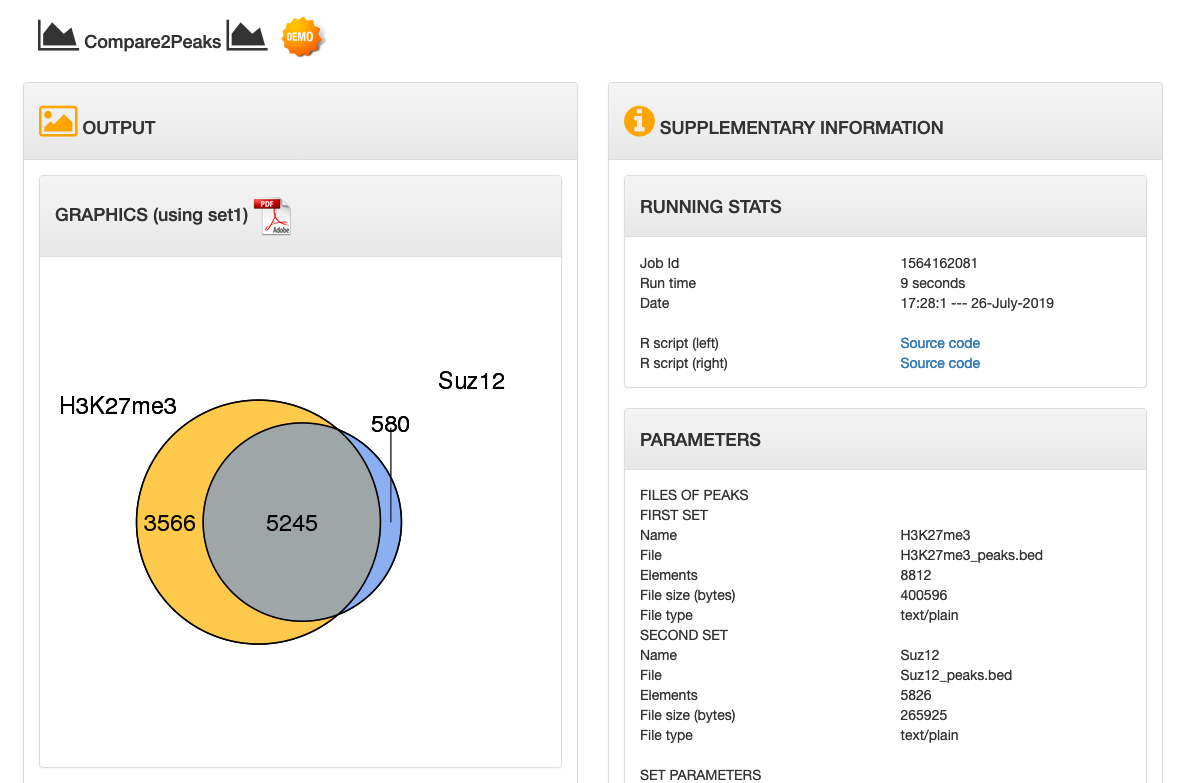
TUTORIAL 1. Compare2Peaks
Compare the genome-wide distribution of peaks of two ChIPseq experiments in mESCs: H3K4me3 and H3K27me3 (bivalent domains).
Access to the demo
Access to the demo
| INPUT | OUTPUT |
|---|---|
 |
 |
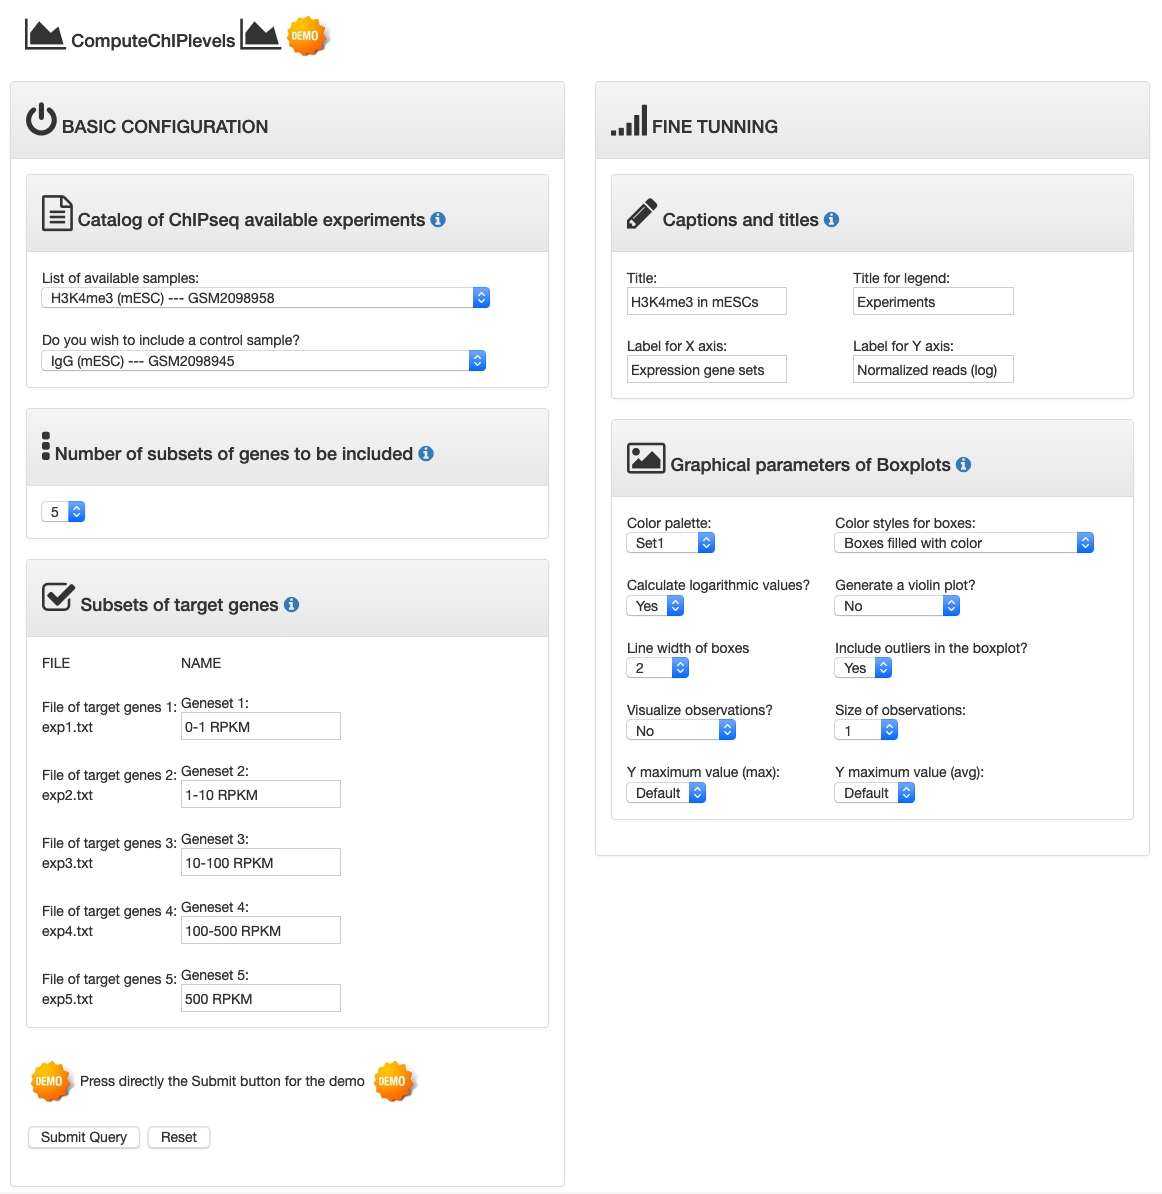
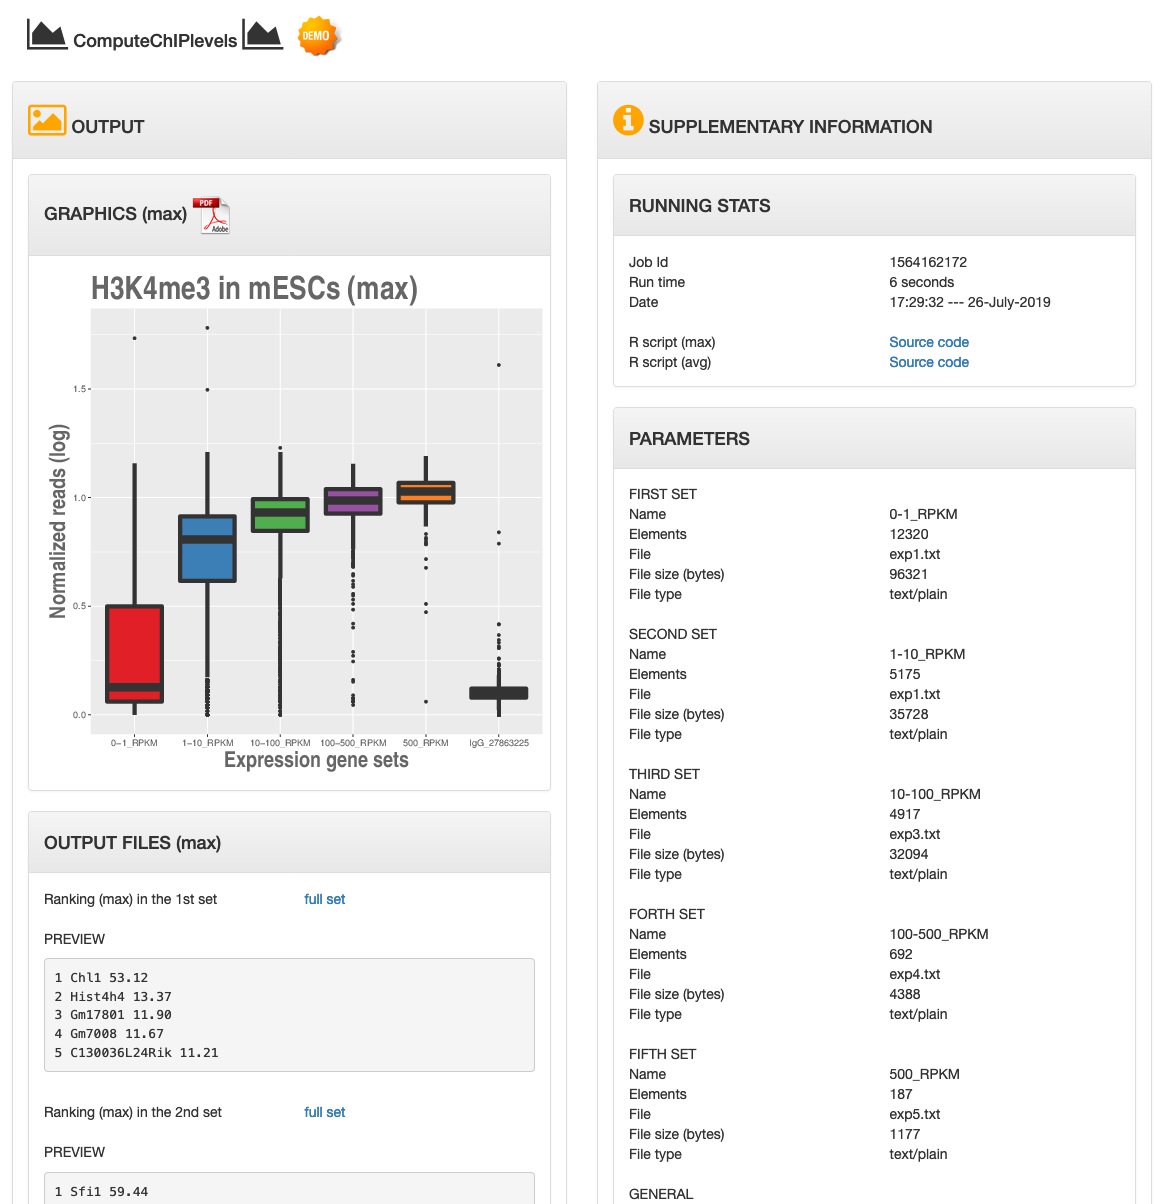
TUTORIAL 2. ComputeChIPlevels
Determine the count of normalized reads of the ChIPseq of H3K4me3 in mESCs for the full catalog of mouse genes stratified by expression.
Access to the demo
Access to the demo
| INPUT | OUTPUT |
|---|---|
 |
 |
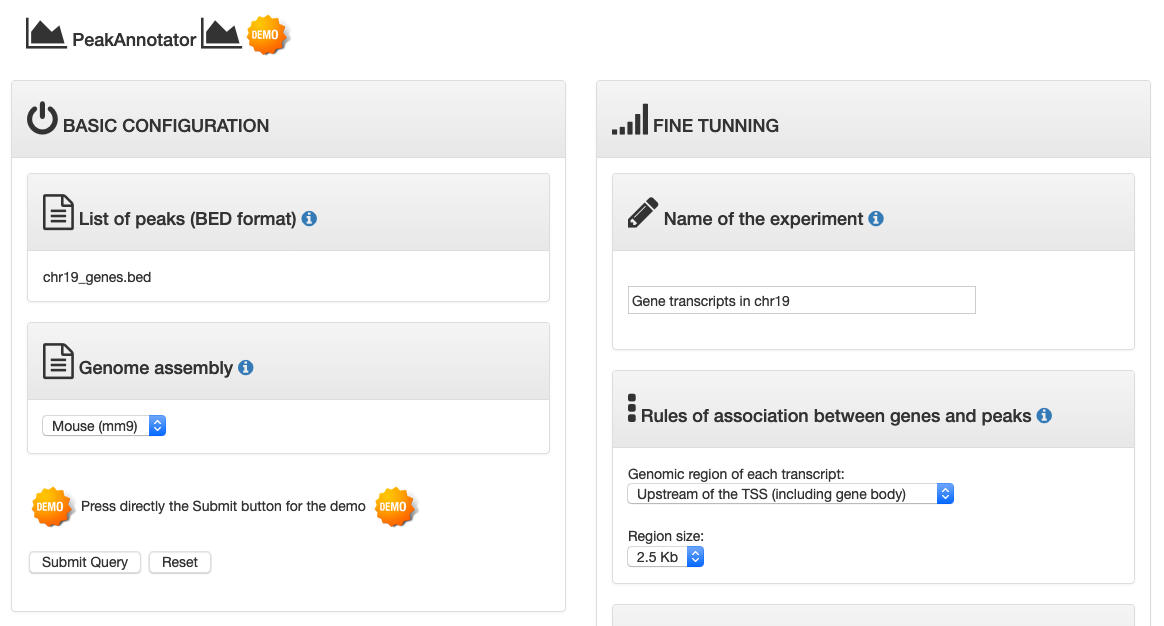
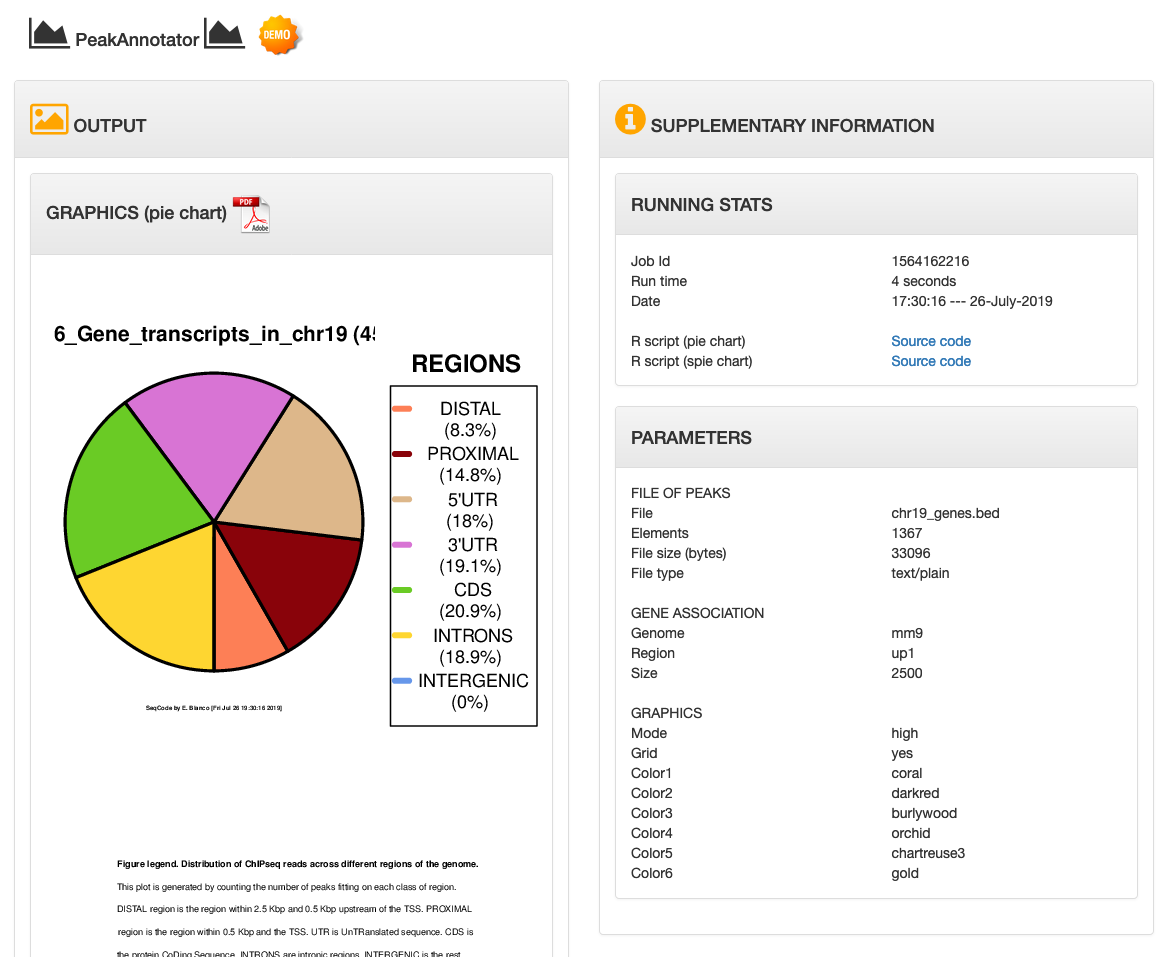
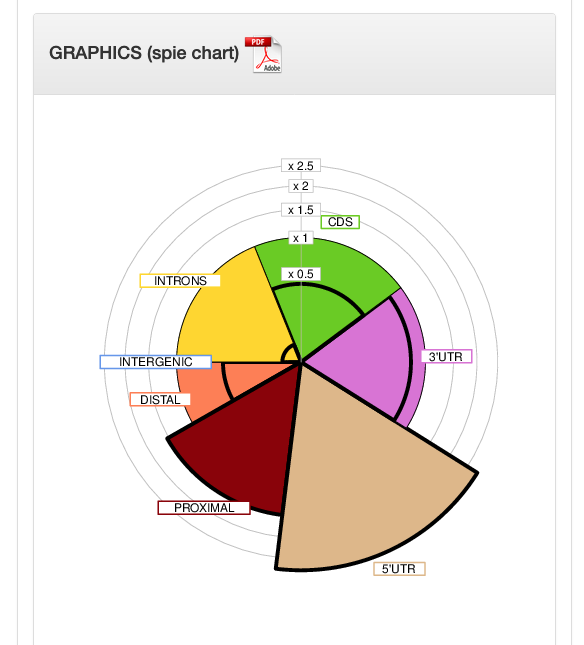
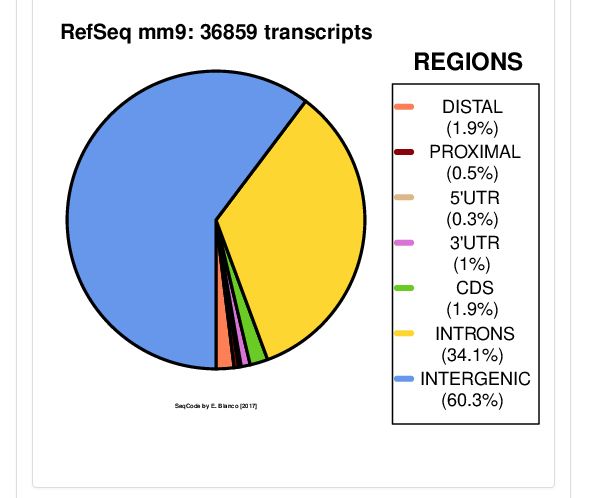
TUTORIAL 3. PeakAnnotator
Distribution of gene categories for the set of regions encoding mouse genes in the chromosome 19.
Access to the demo
Access to the demo
| INPUT | ||
|---|---|---|
 |
||
| OUTPUT | ||
 |
 |
 |
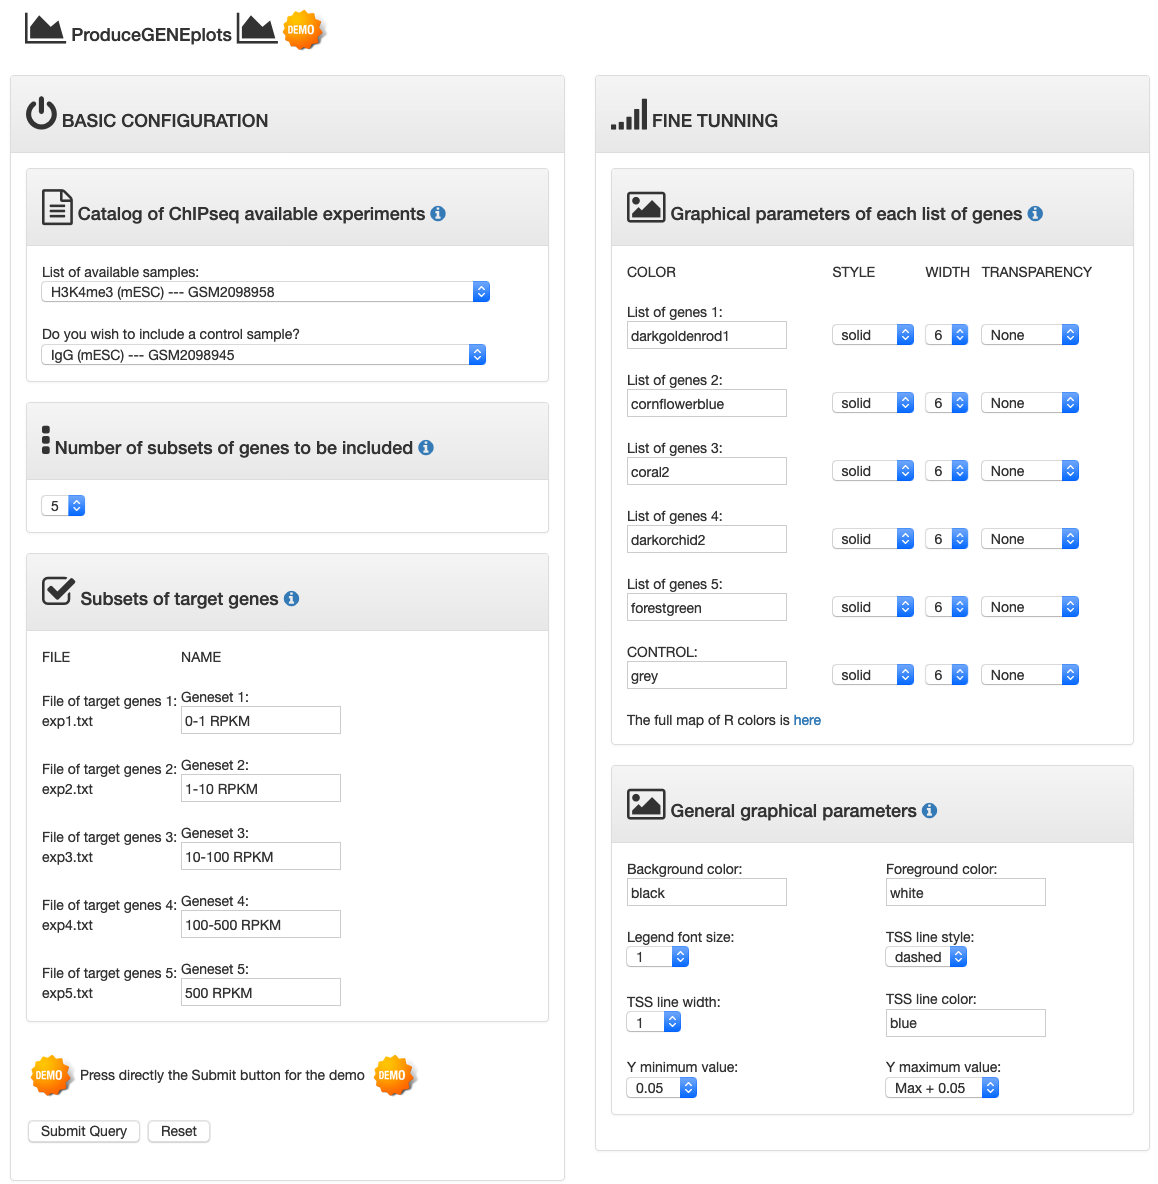
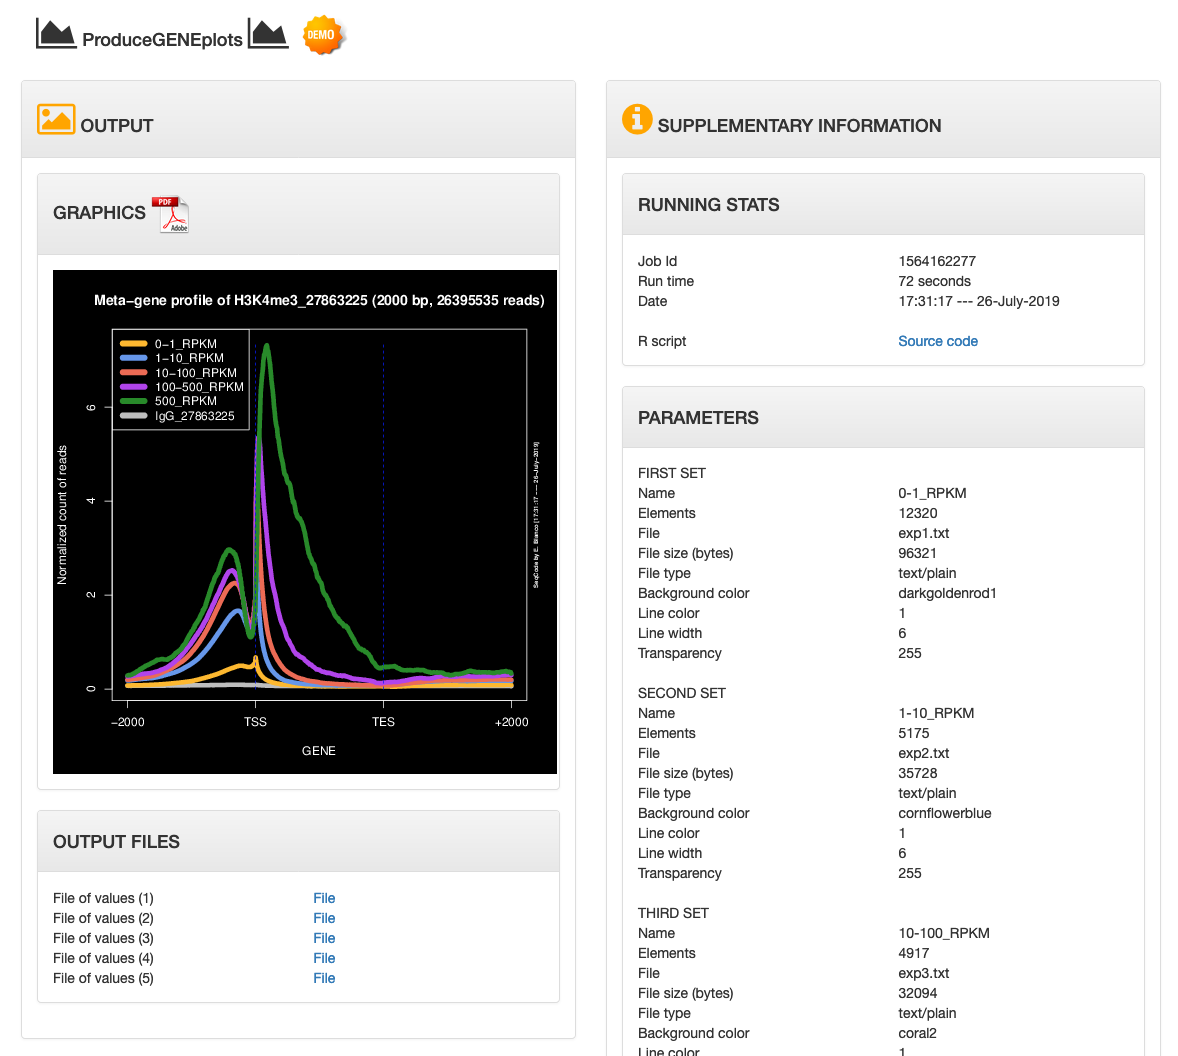
TUTORIAL 4. ProduceGENEplots
Meta-gene plot of the ChIPseq of H3K4me3 in mESC for the full catalog of mouse genes stratified by expression.
Access to the demo
Access to the demo
| INPUT | OUTPUT |
|---|---|
 |
 |
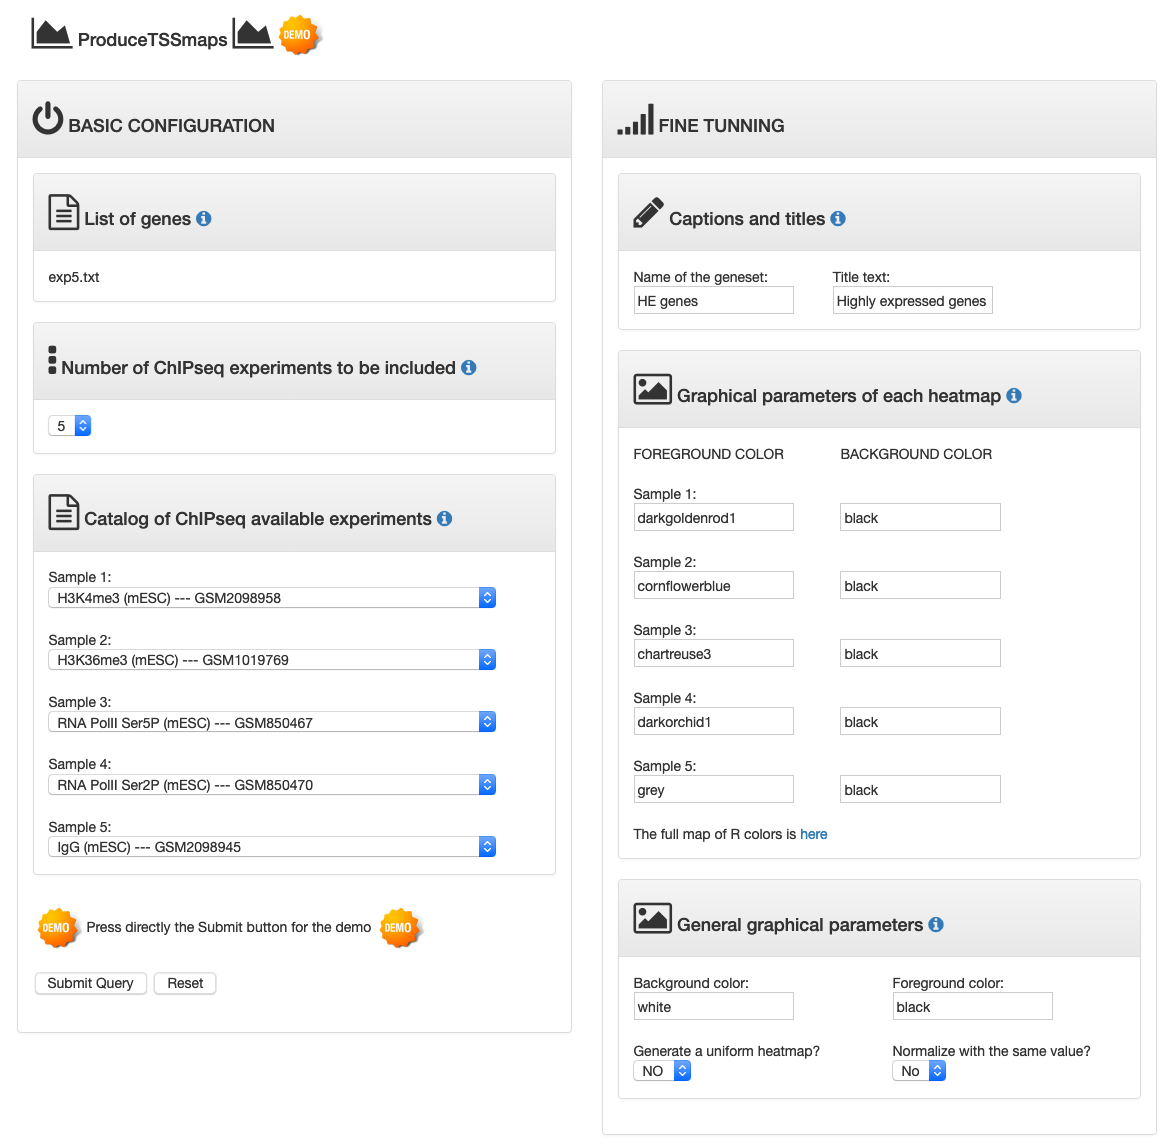
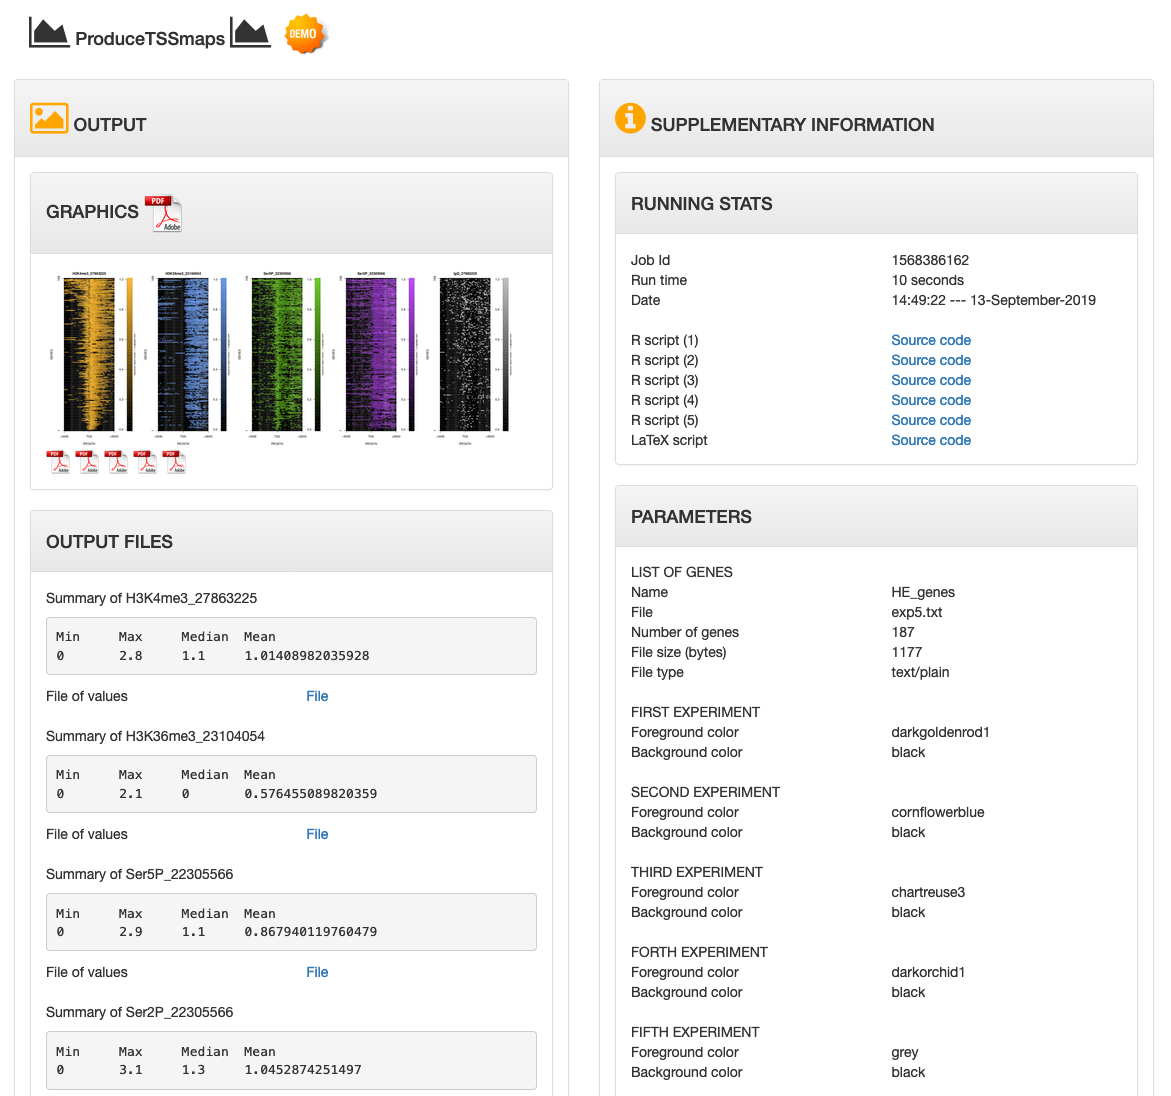
TUTORIAL 5. ProduceTSSmaps
Heatmap of ChIPseq signal of H3K4me3/H3K36me3, RNA polymerase II (Ser5P/Ser2P) and IgG in mESCs for a set of genes.
Access to the demo
Access to the demo
| INPUT | OUTPUT |
|---|---|
 |
 |
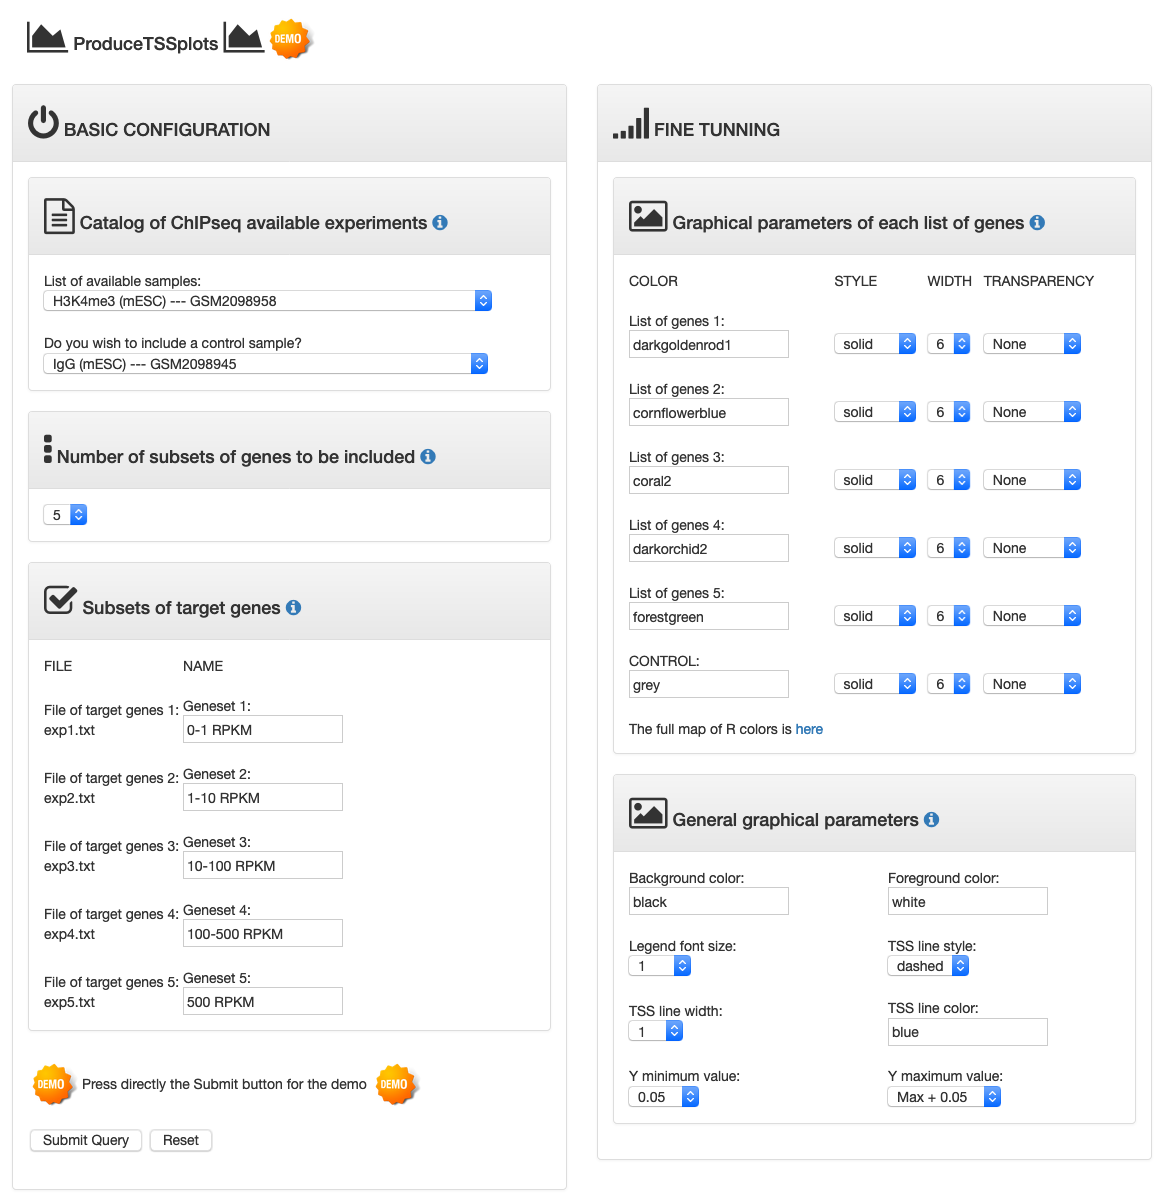
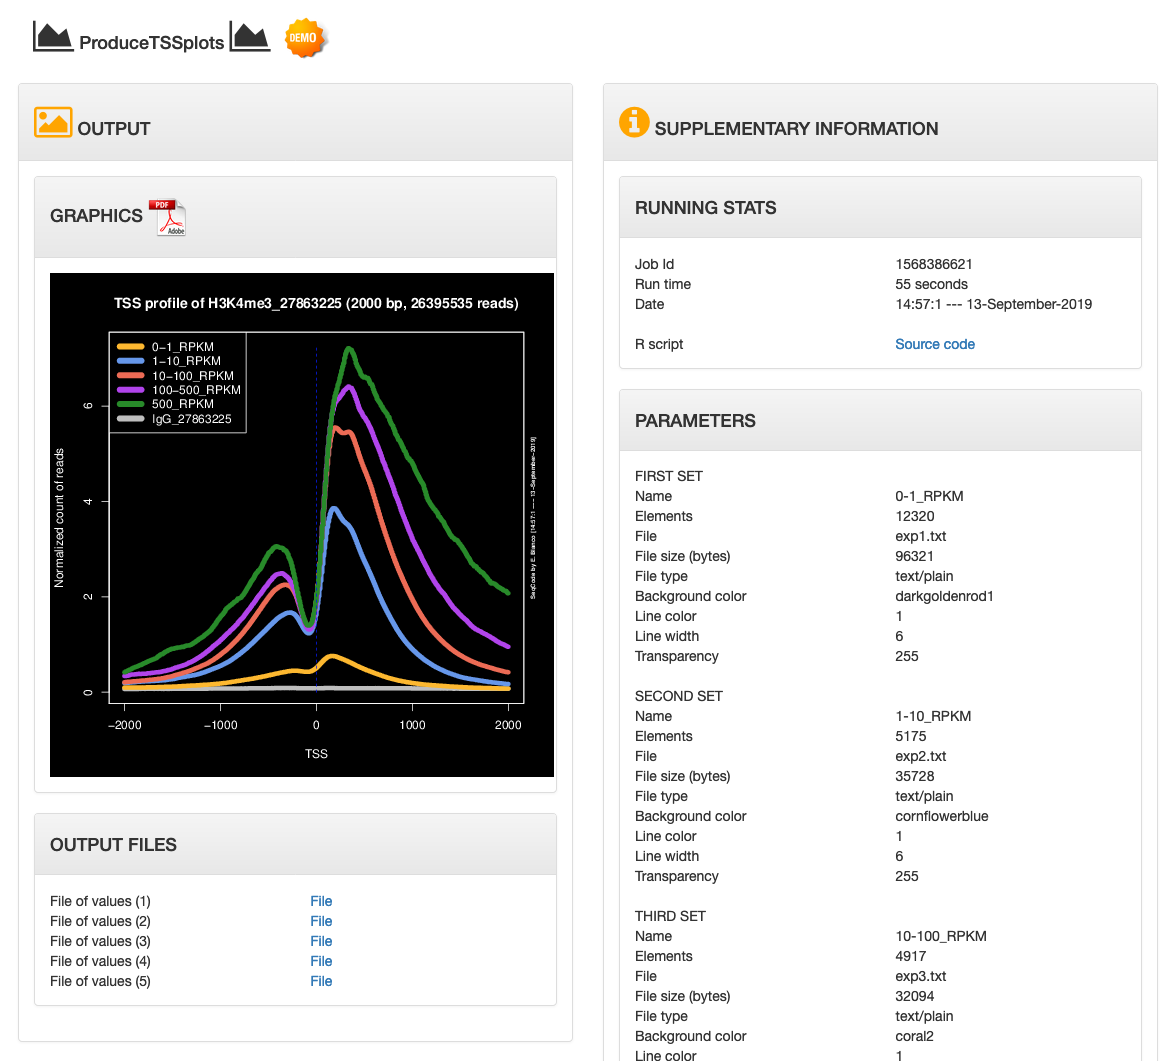
TUTORIAL 6. ProduceTSSplots
Aggregated plot of the ChIPseq of H3K4me3 in mESC around the TSS of the full catalog of mouse genes stratified by expression.
Access to the demo
Access to the demo
| INPUT | OUTPUT |
|---|---|
 |
 |
Data Sets
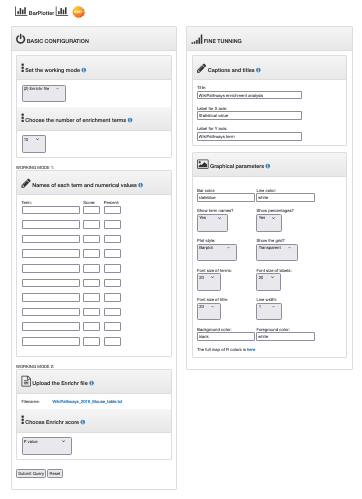
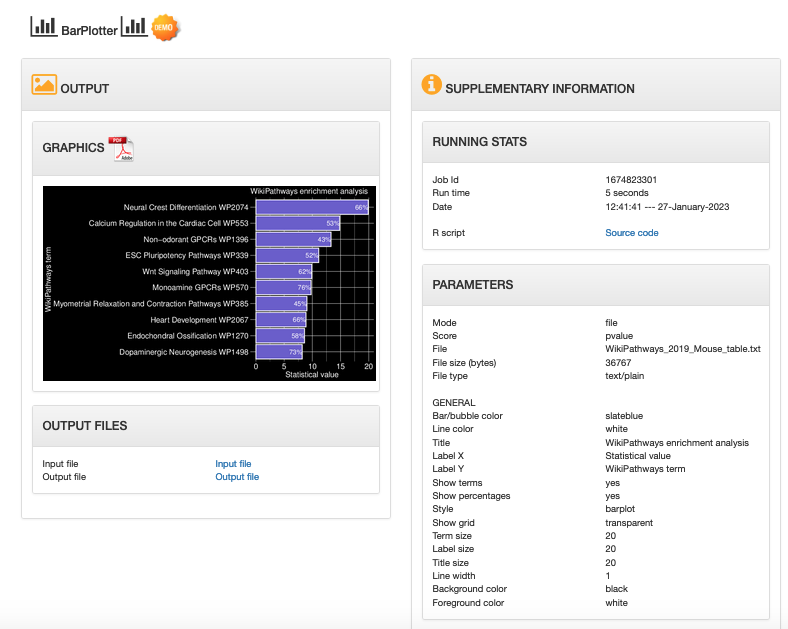
TUTORIAL 7. BarPlotter
Barplot of gene ontology analysis performed with the external tool Enrichr.
Access to the demo
Access to the demo
| INPUT | OUTPUT |
|---|---|
 |
 |
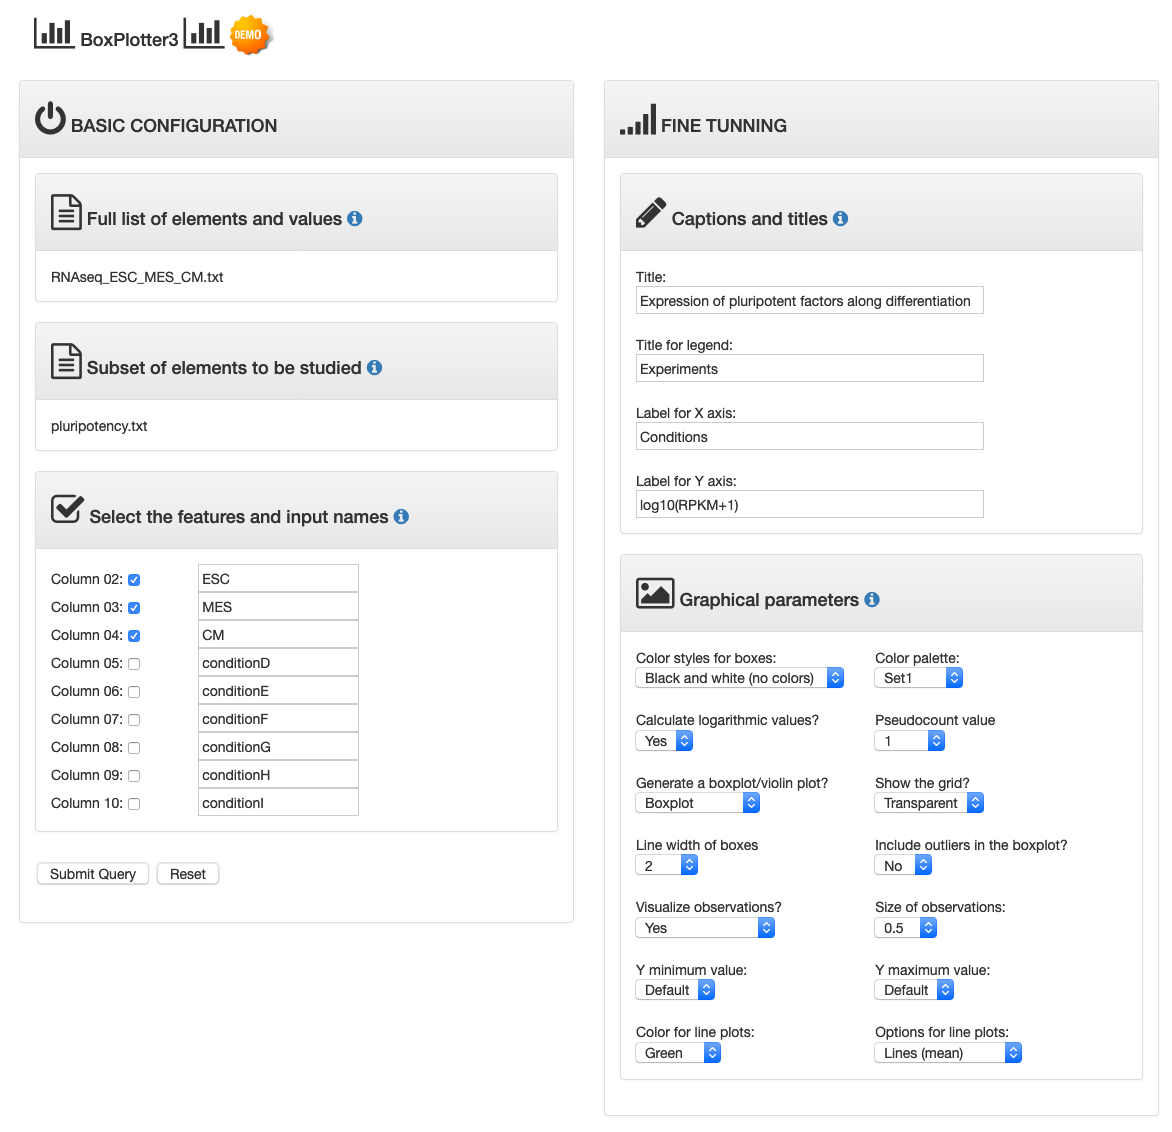
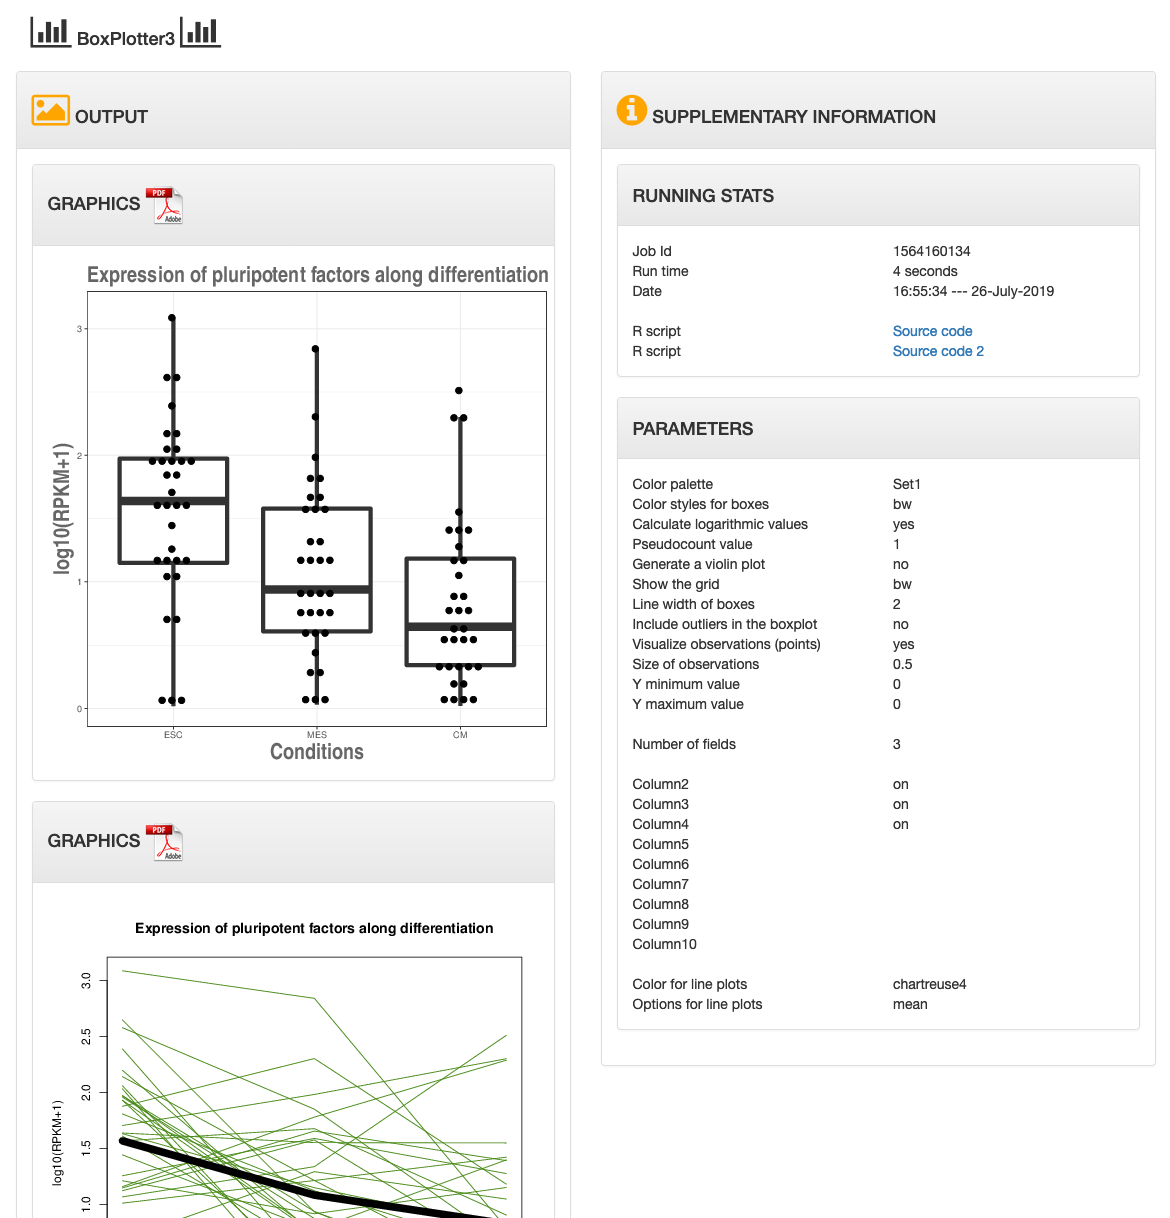
TUTORIAL 8. BoxPlotter3
Boxplot of expression of pluripotency gene markers along several time points of cardiac differentiation.
Access to the demo
Access to the demo
| INPUT | OUTPUT |
|---|---|
 |
 |
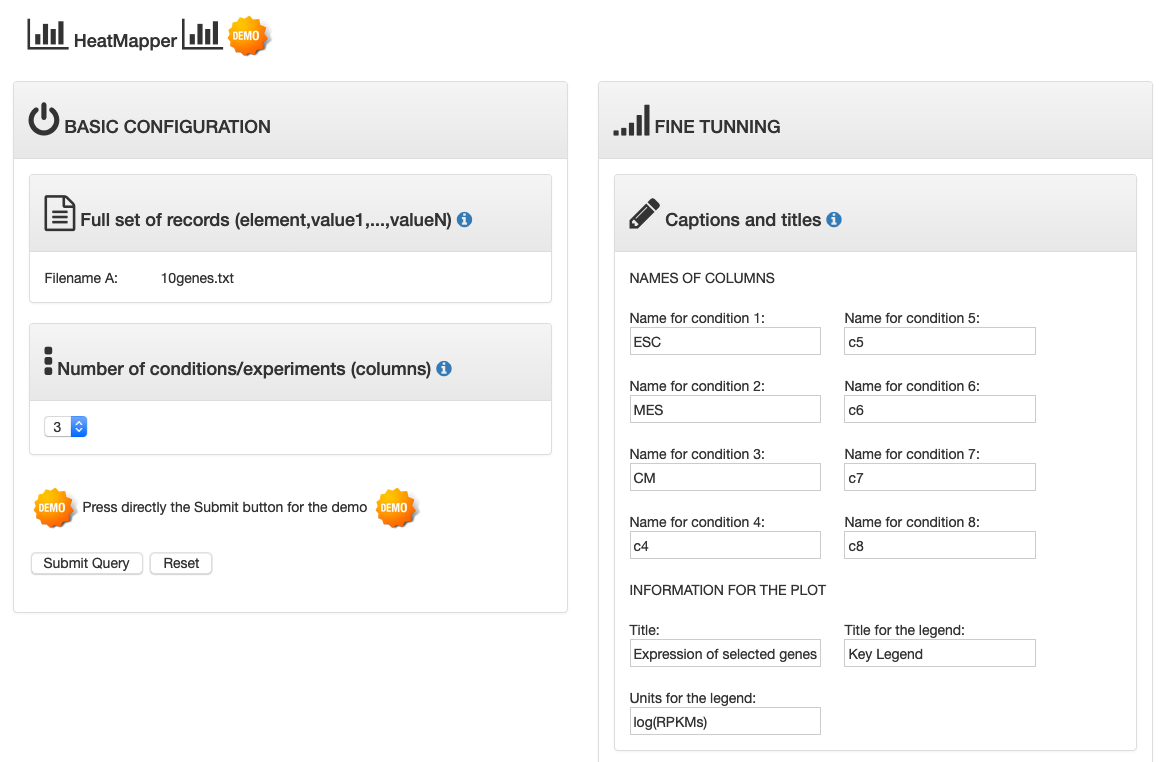
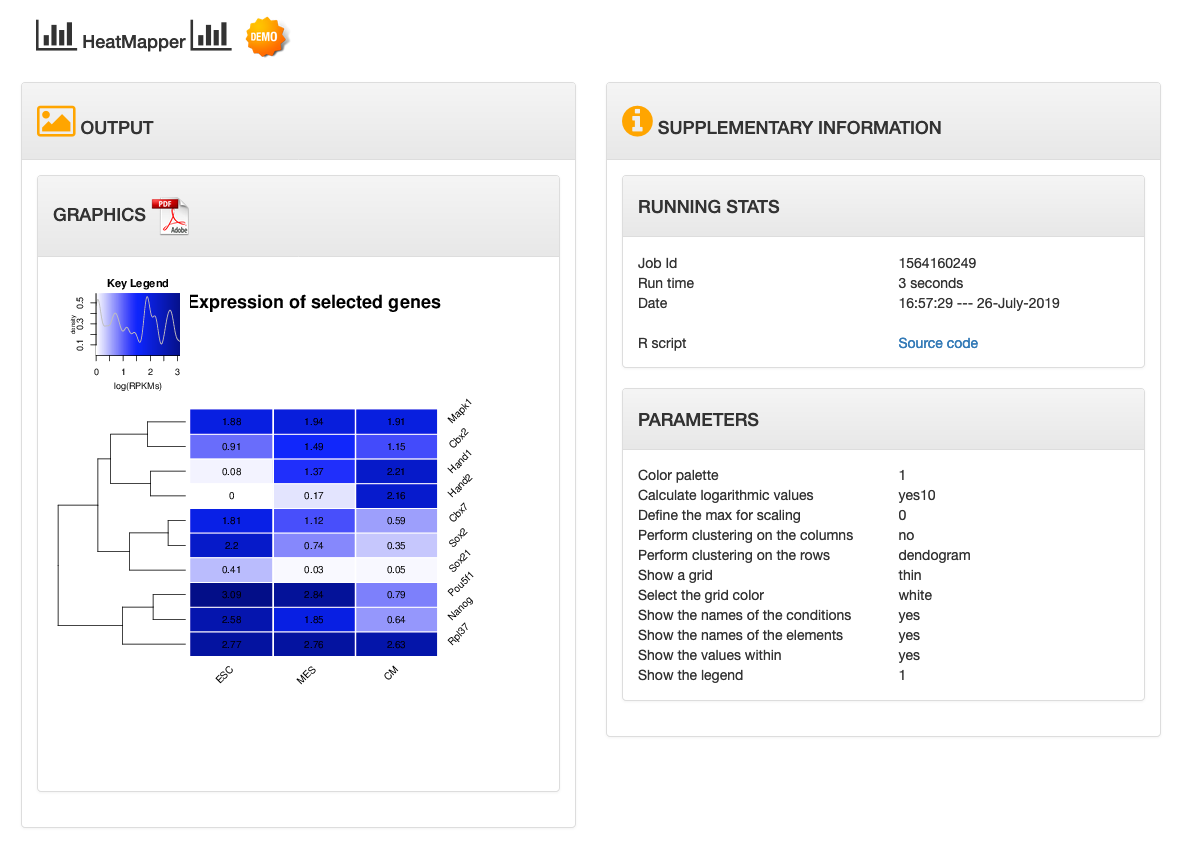
TUTORIAL 9. HeatMapper
Heatmap of expression values along cardiac differentiation of selected genes.
Access to the demo
Access to the demo
| INPUT | OUTPUT |
|---|---|
 |
 |
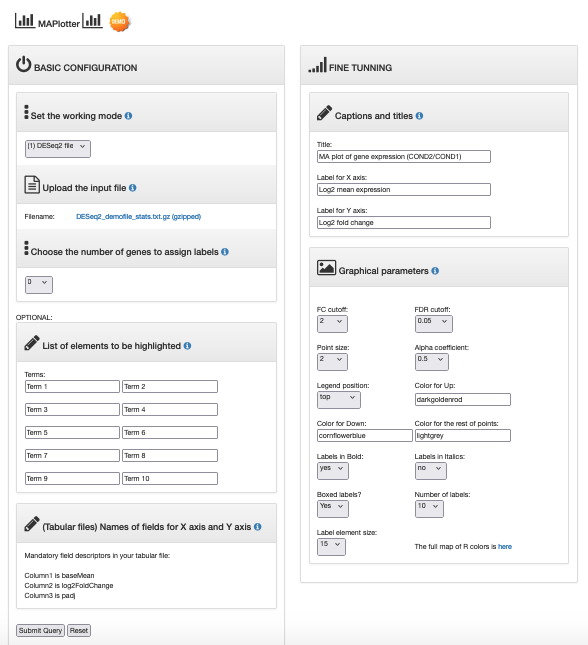
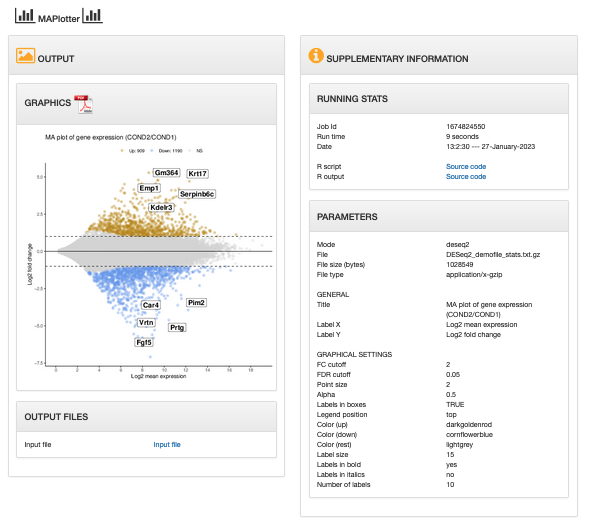
TUTORIAL 10. MAplotter
MAploto of DEseq2 differential gene expression analysis in embryonic stem cells upon differentiation.
Access to the demo
Access to the demo
| INPUT | OUTPUT |
|---|---|
 |
 |
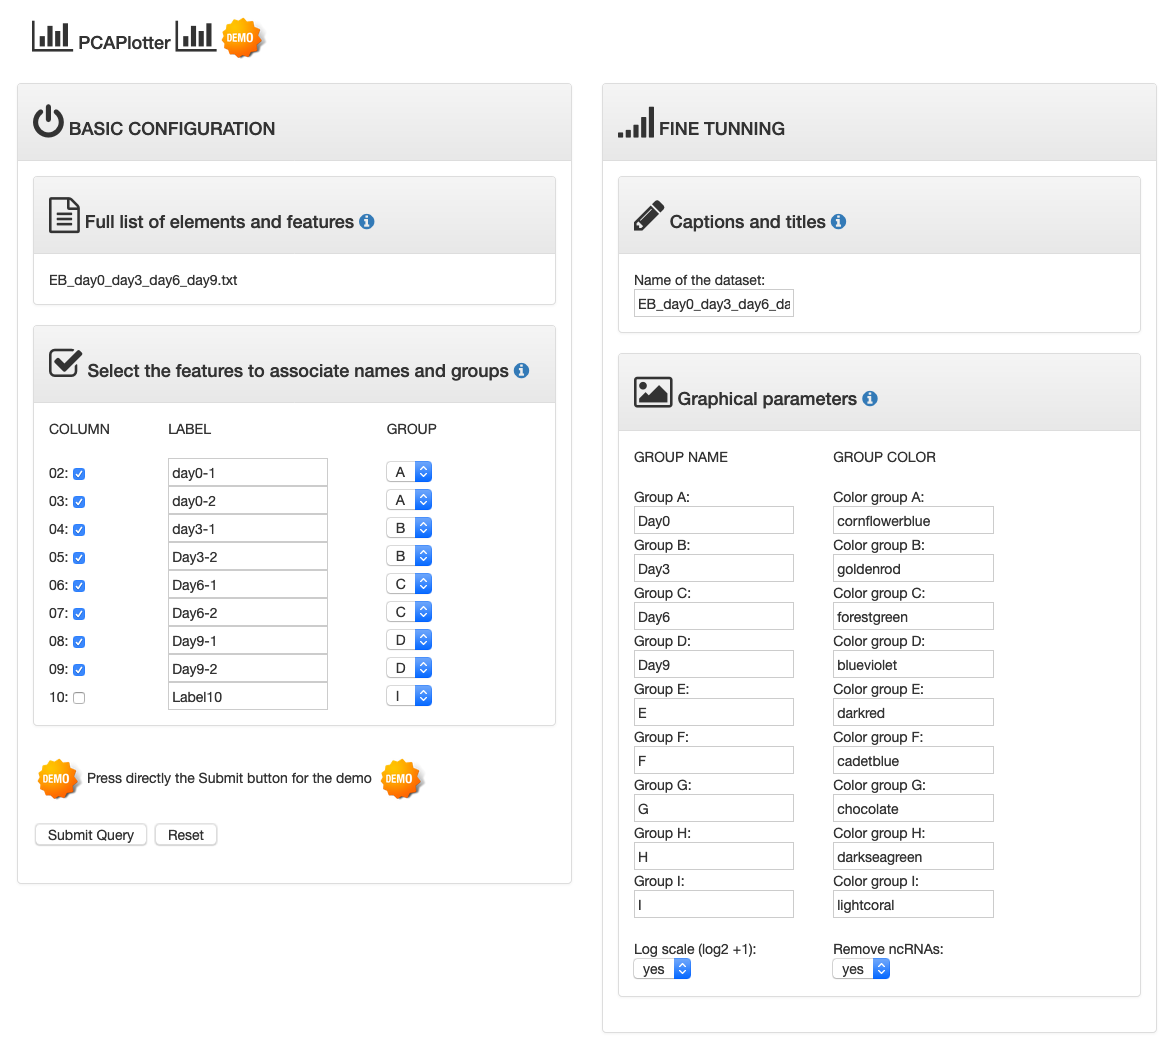
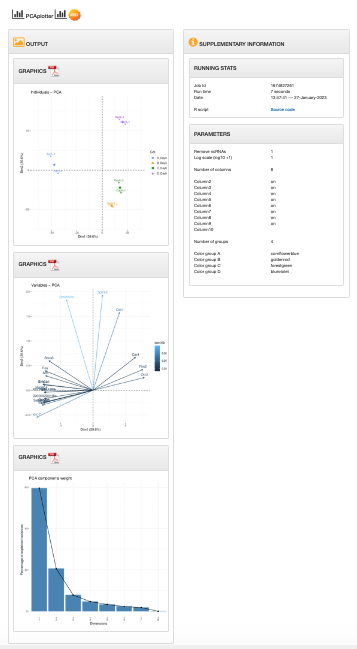
TUTORIAL 11. PCAplotter
PCA analysis of eight RNAseq experiments in duplicates for embryoid bodies that are differentiated.
Access to the demo
Access to the demo
| INPUT | OUTPUT |
|---|---|
 |
 |
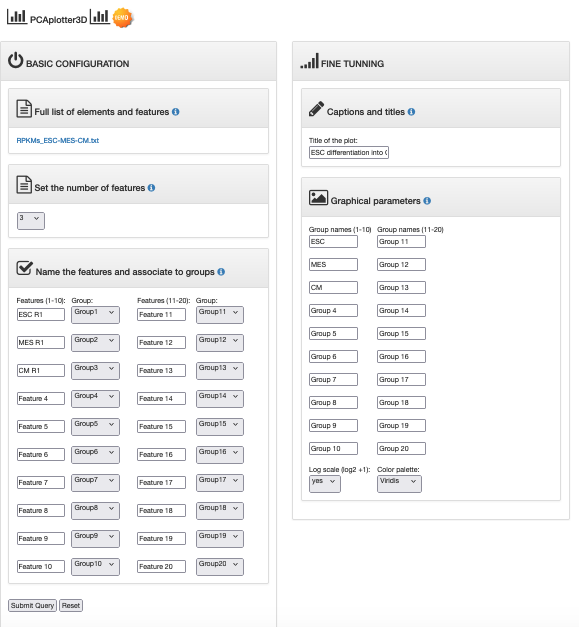
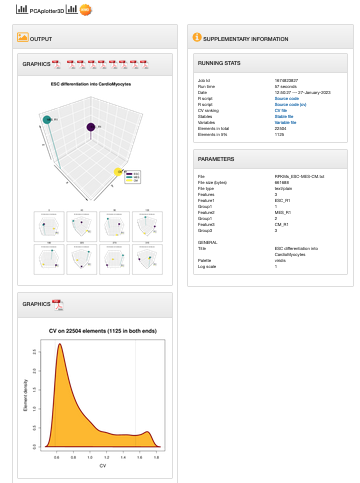
TUTORIAL 12. PCAplotter3D
PCA analysis in 3D of RNAseq experiments of embryonic stem cells to mesoderm precursors to cardiomyocytes upon differentiation.
Access to the demo
Access to the demo
| INPUT | OUTPUT |
|---|---|
 |
 |
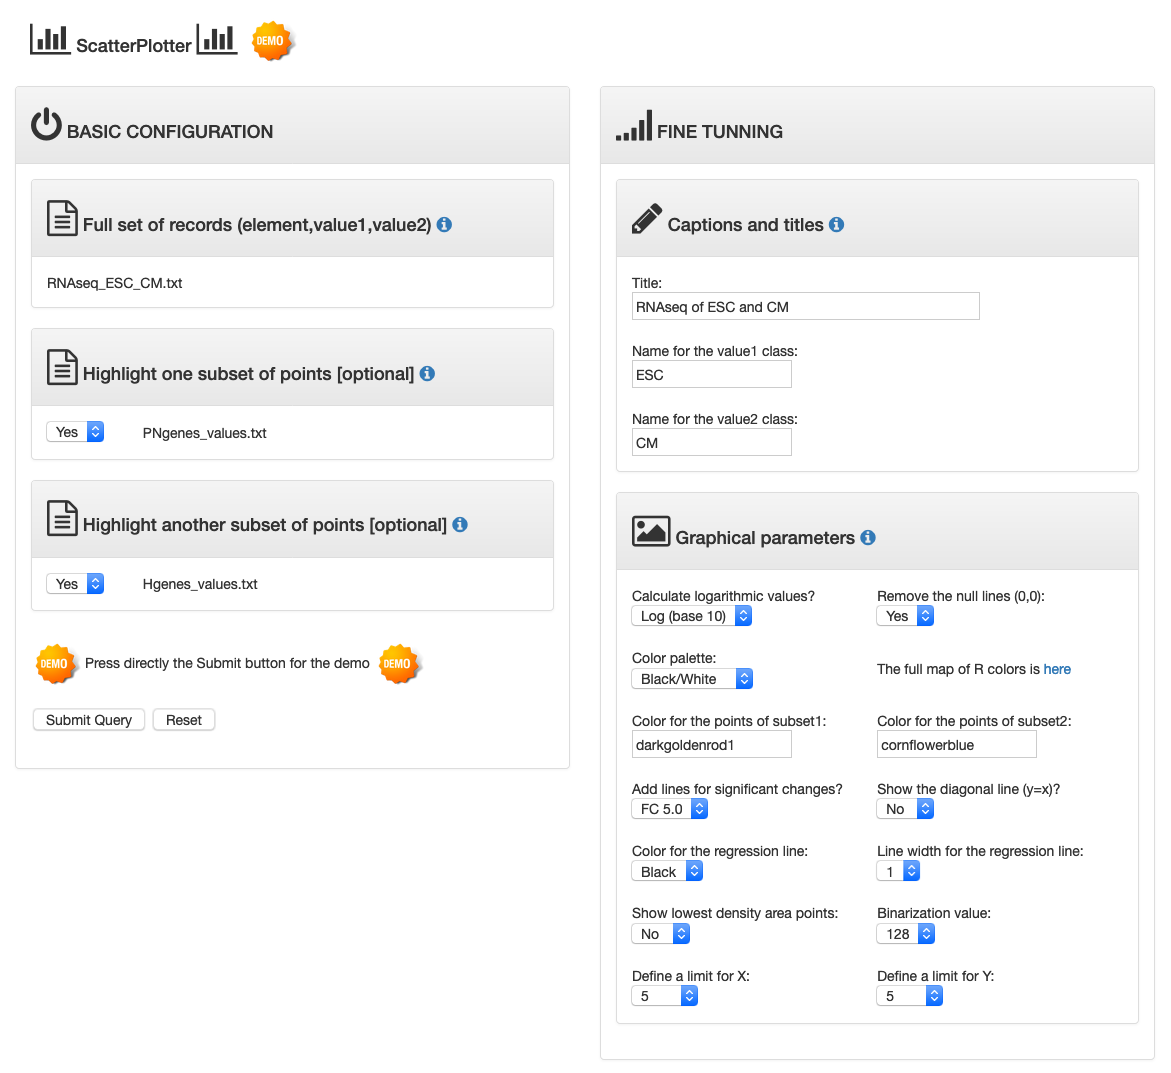
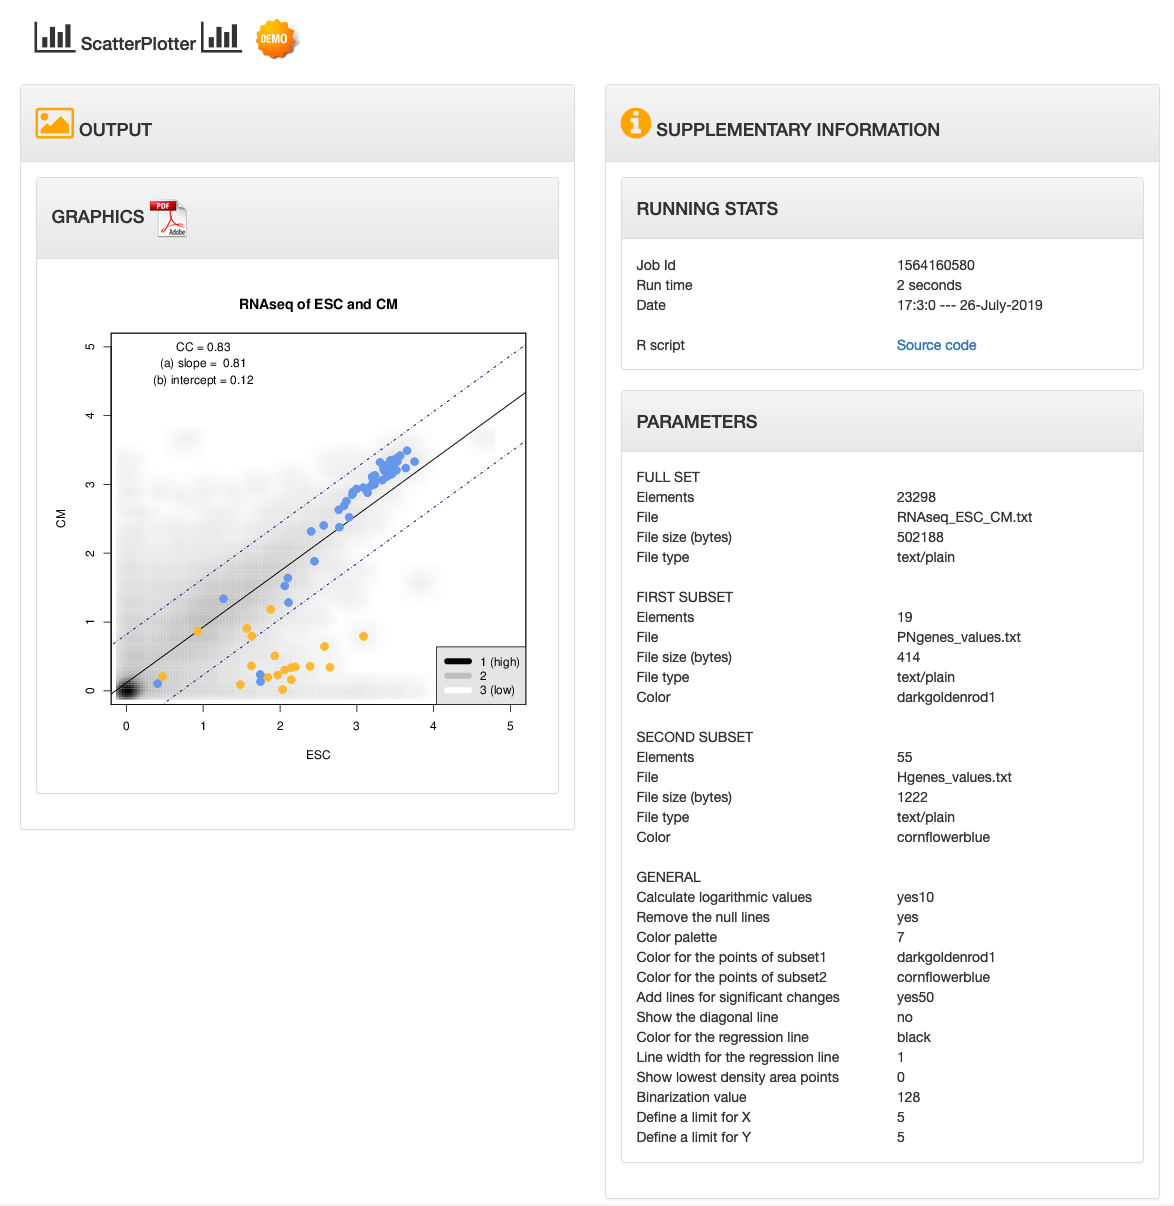
TUTORIAL 13. ScatterPlotter
Scatterplot of gene expression values for the whole genome, highlighting pluripotency markers and housekeeping genes.
Access to the demo
Access to the demo
| INPUT | OUTPUT |
|---|---|
 |
 |
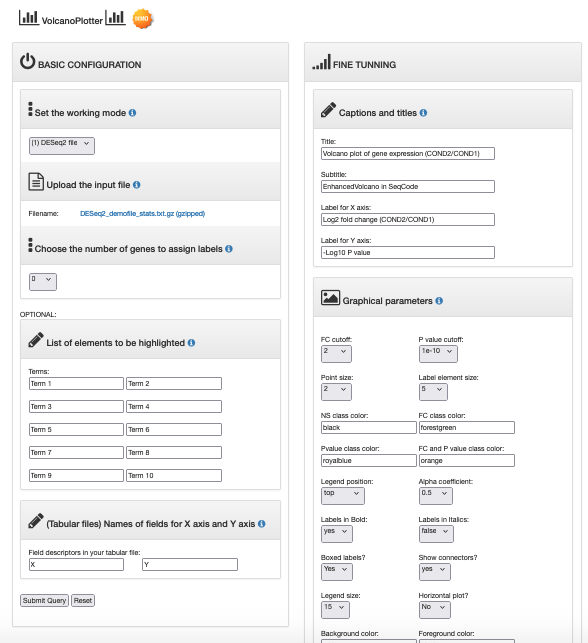
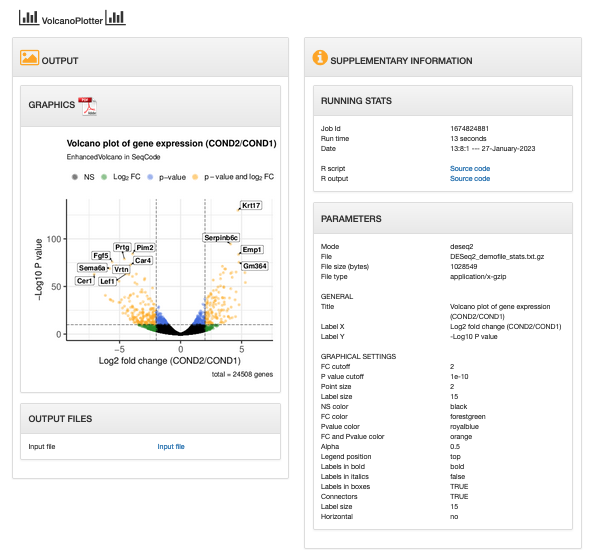
TUTORIAL 14. VolcanoPlotter
Volcano plot of DESeq2 output from differential gene expression analysis of embryonic stem cells upon differentiation.
Access to the demo
Access to the demo
| INPUT | OUTPUT |
|---|---|
 |
 |
Data Sets
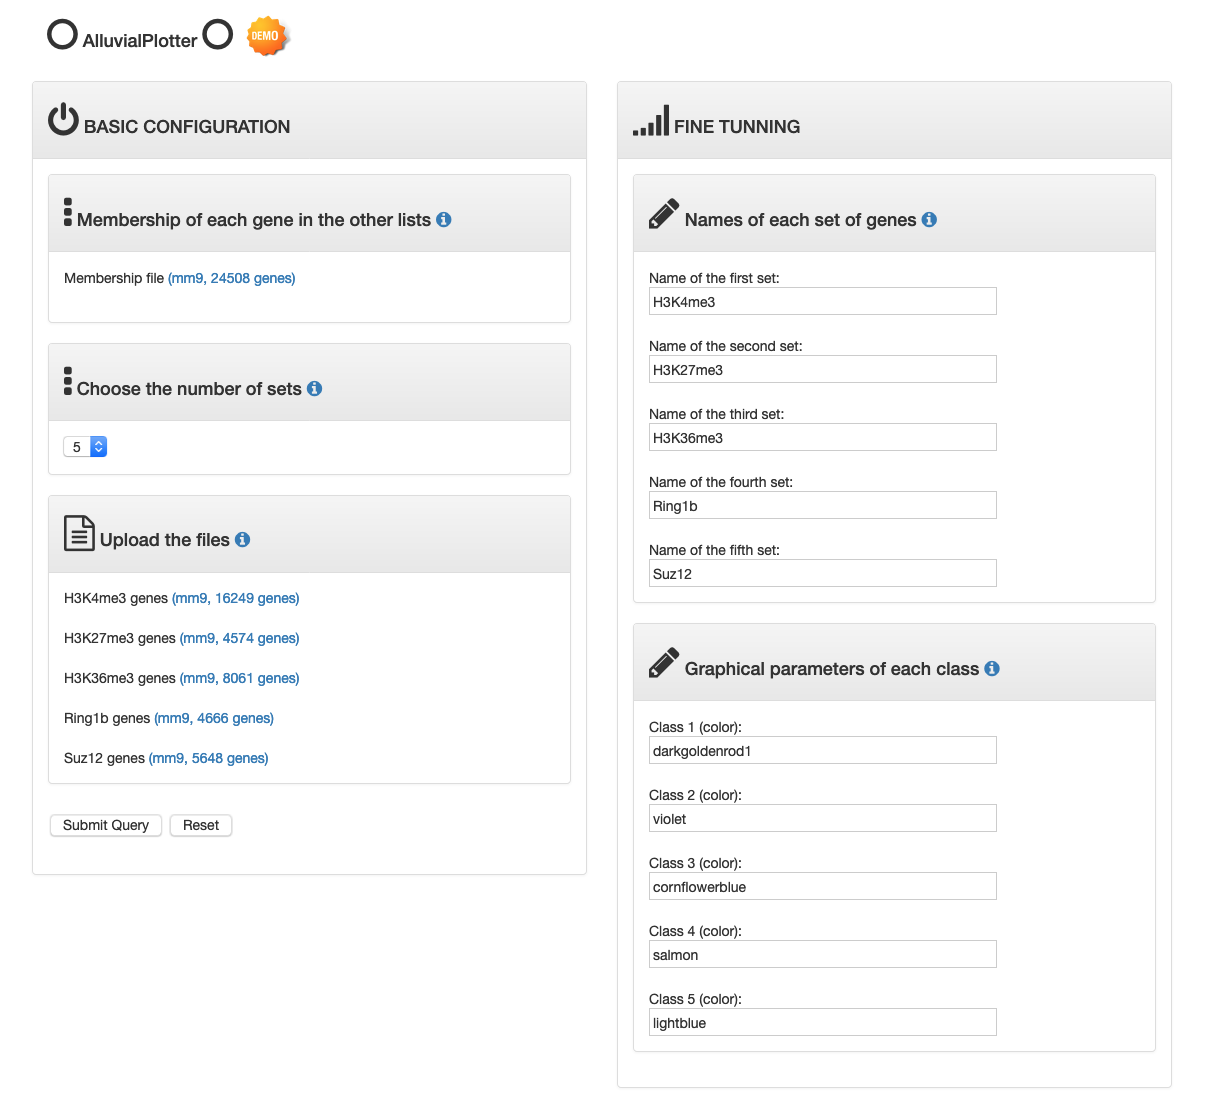
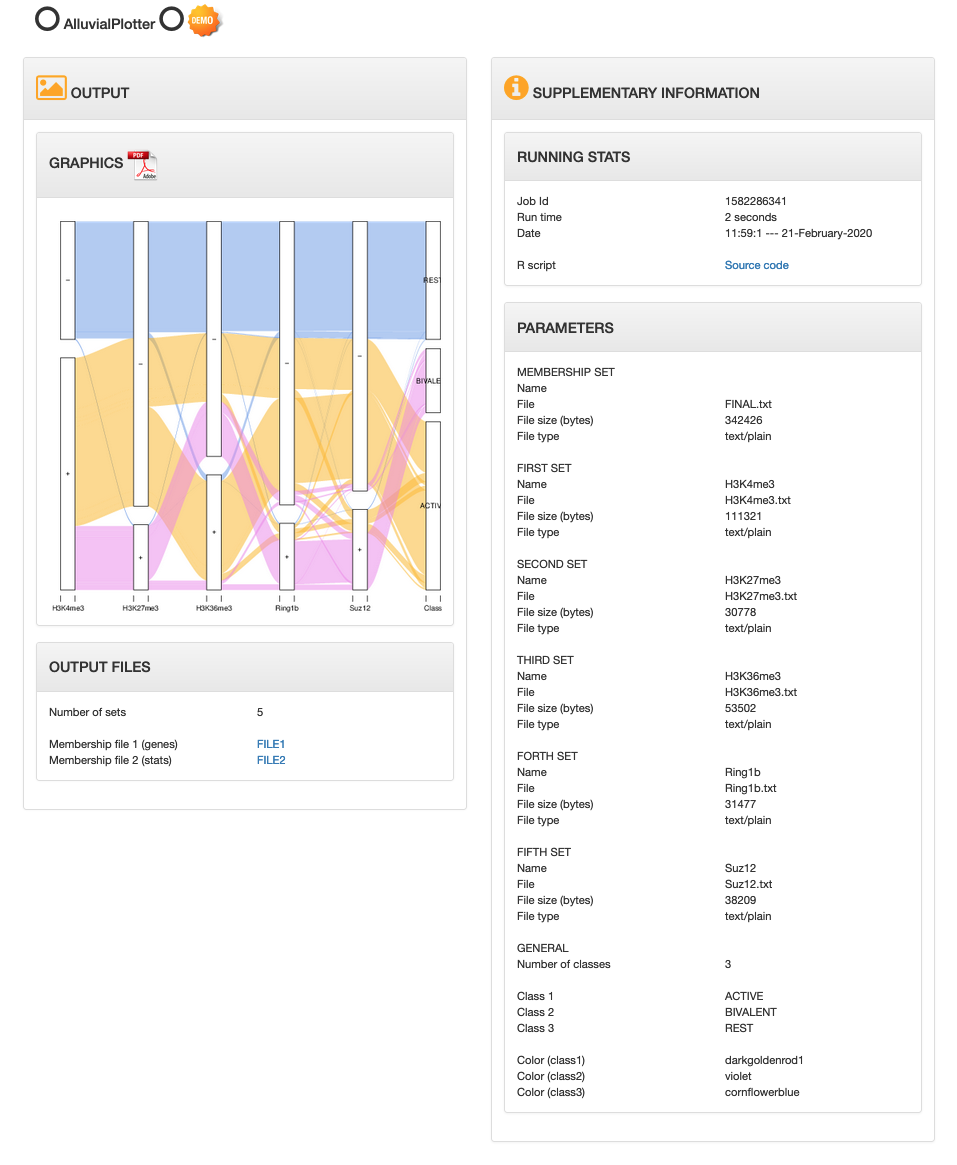
TUTORIAL 15. AlluvialPlotter
Alluvial diagram that shows the relationships between H3K4me3, H3K27me3, H3K36me3, Ring1b and Suz12 (mouse ESCs) in the full set of 24508 genes (mm9).
Access to the demo
Access to the demo
| INPUT | OUTPUT |
|---|---|
 |
 |
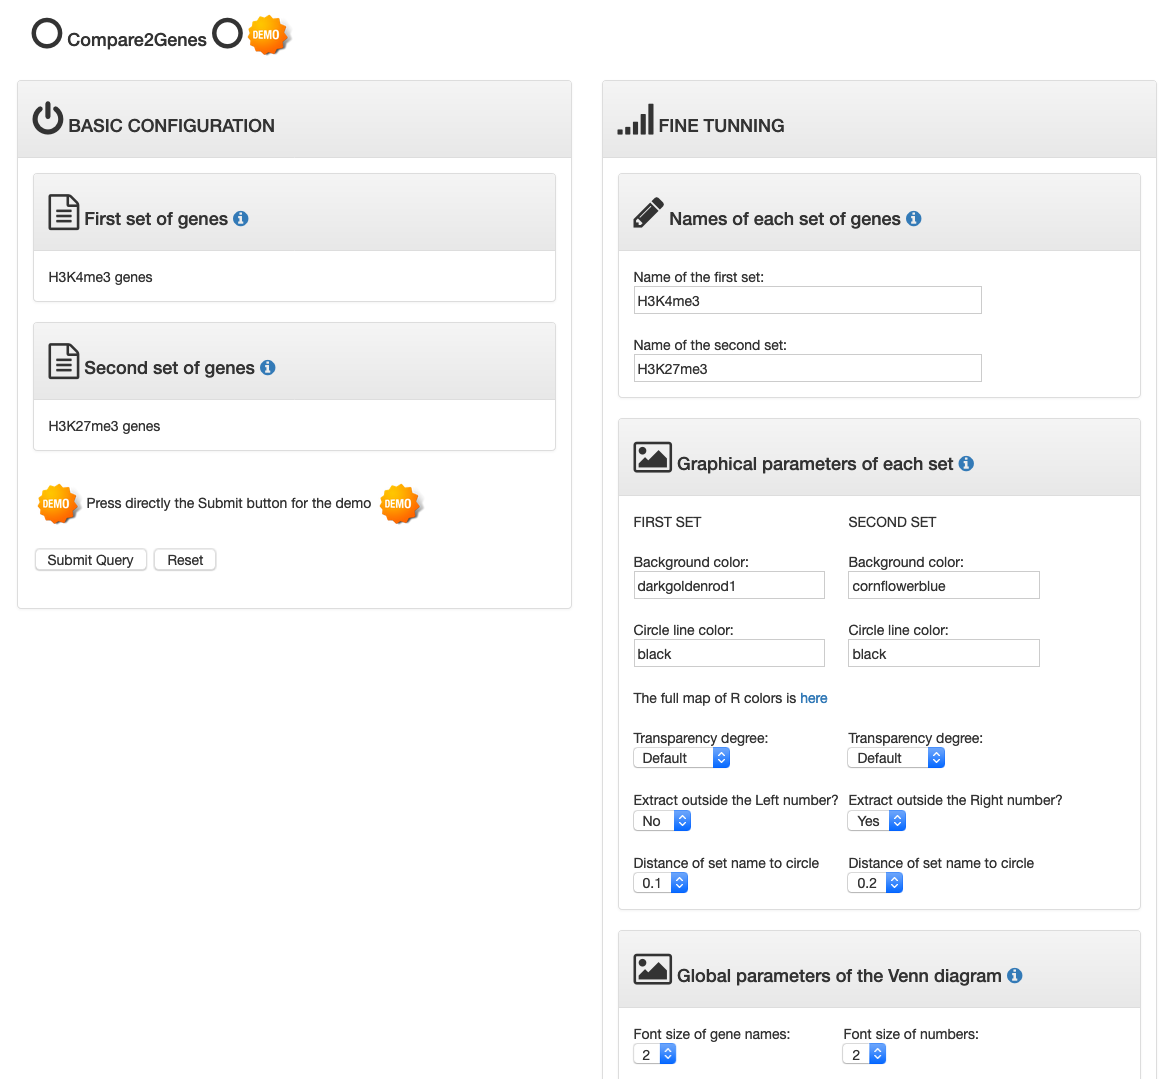
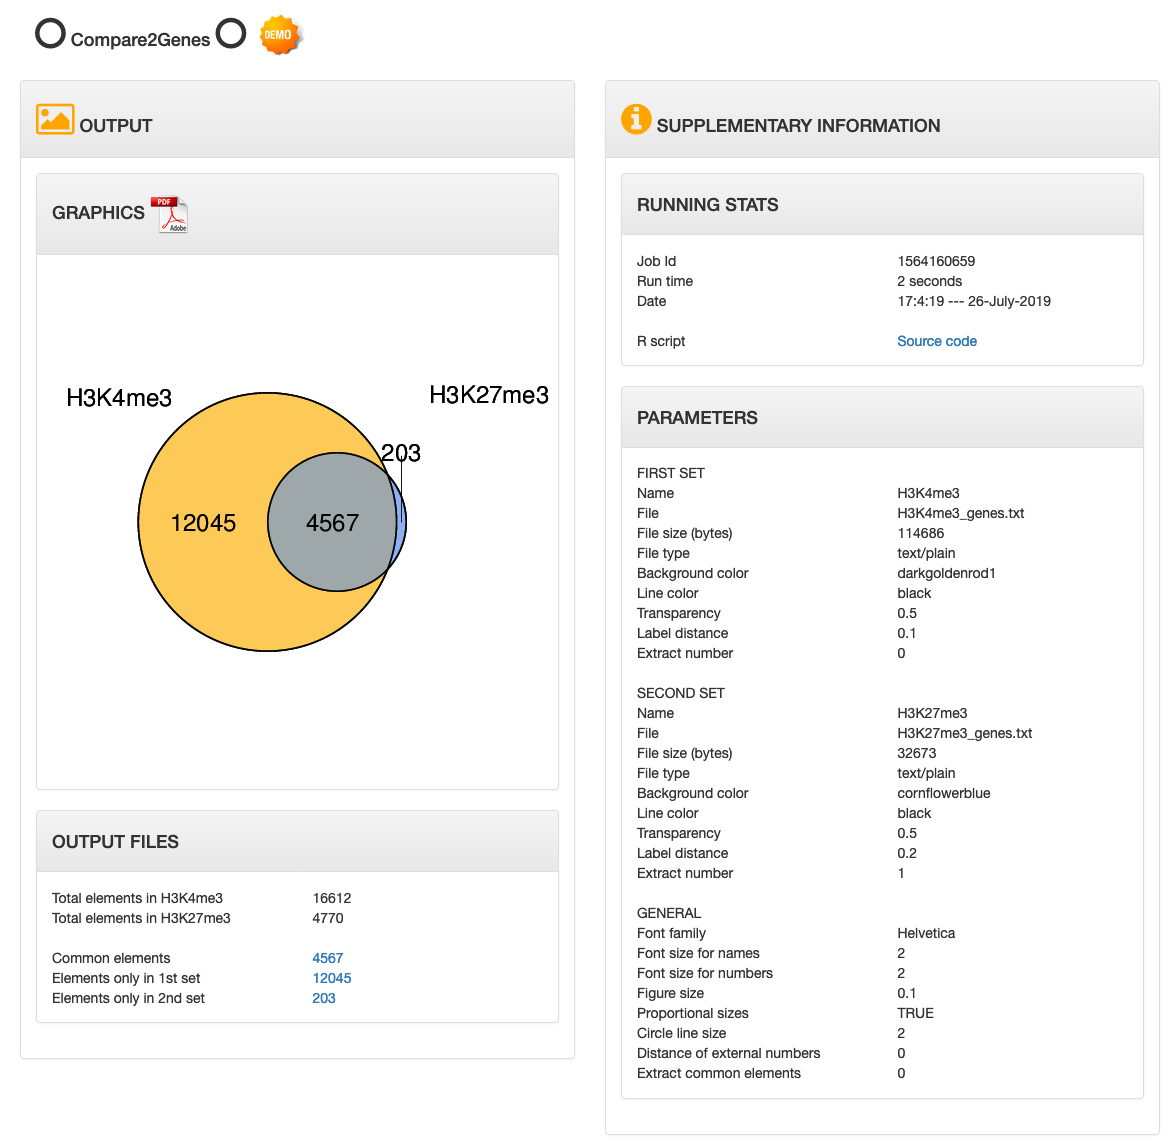
TUTORIAL 16. Compare2Genes
Venn diagram that shows the overlap between H3K4me3 and H3K27me3 target genes (bivalent genes).
Access to the demo
Access to the demo
| INPUT | OUTPUT |
|---|---|
 |
 |
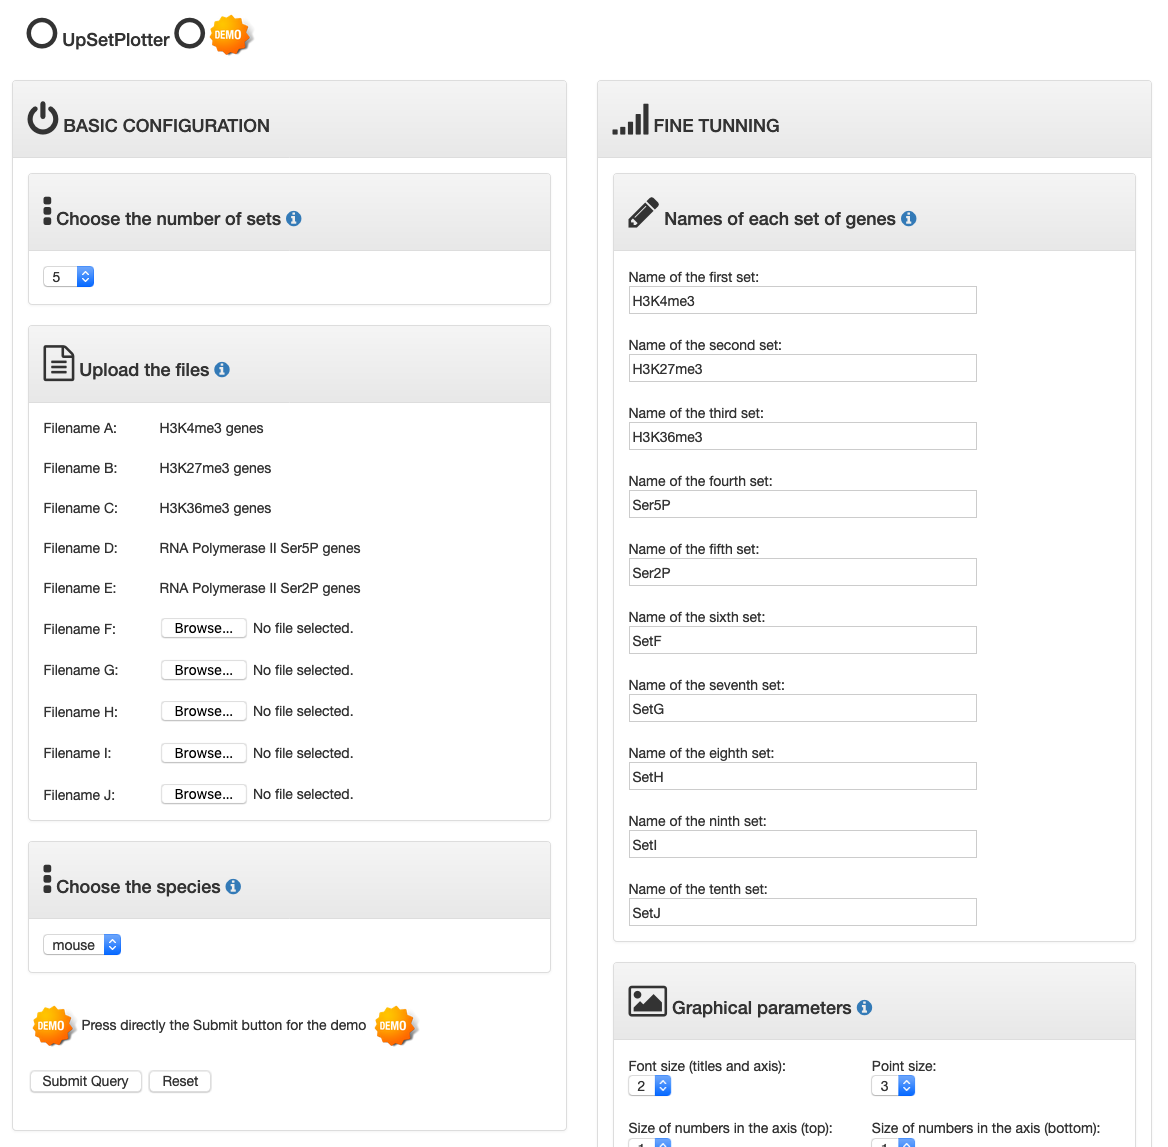
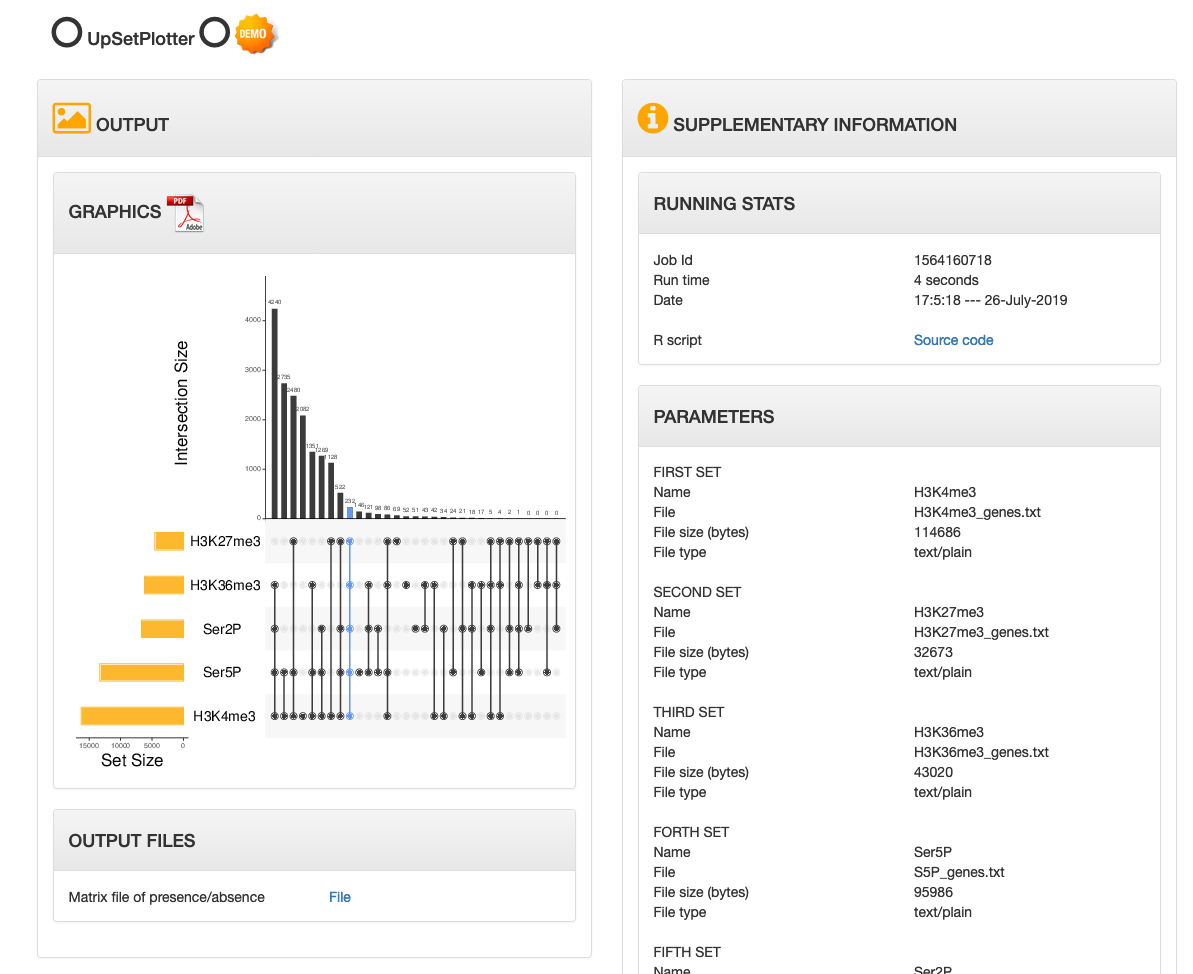
TUTORIAL 17. UpSetPlotter
UpSet chart that displays distinct overlapping subsets of target genes of H3K4me3, H3K27me3, H3K36me3 and RNA polymerase II modifications.
Access to the demo
Access to the demo
| INPUT | OUTPUT |
|---|---|
 |
 |
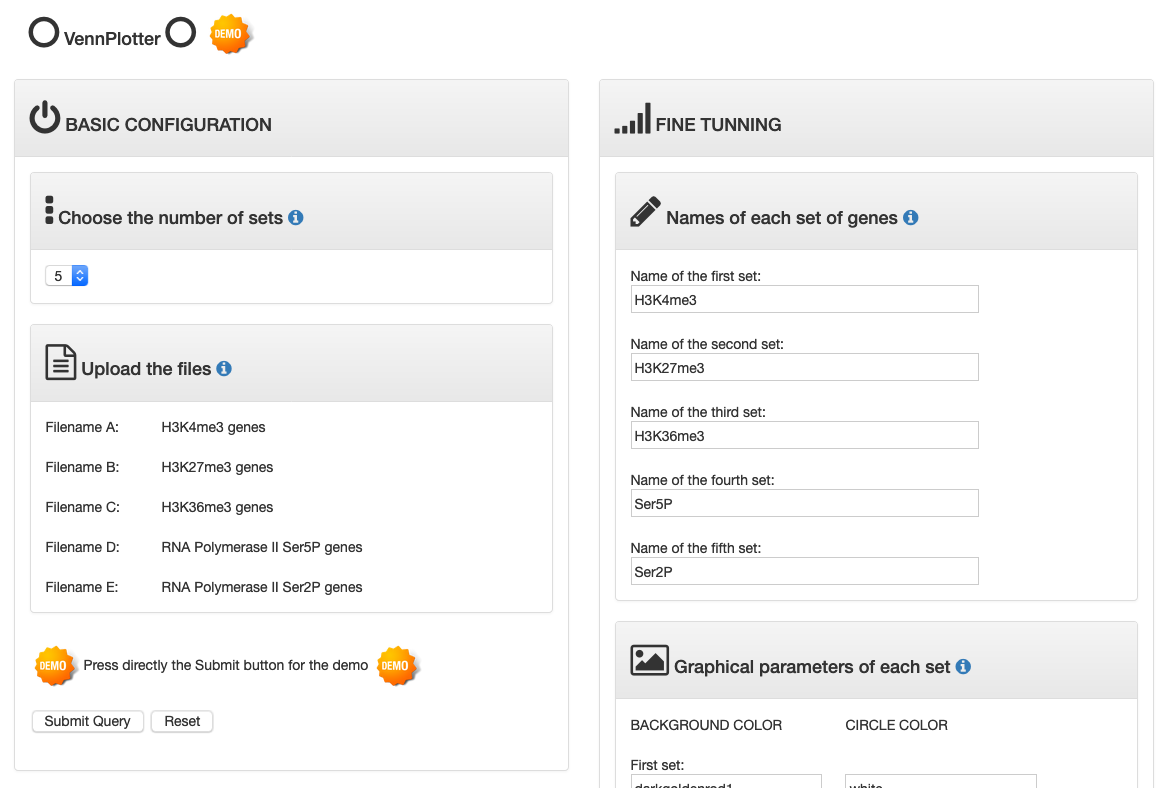
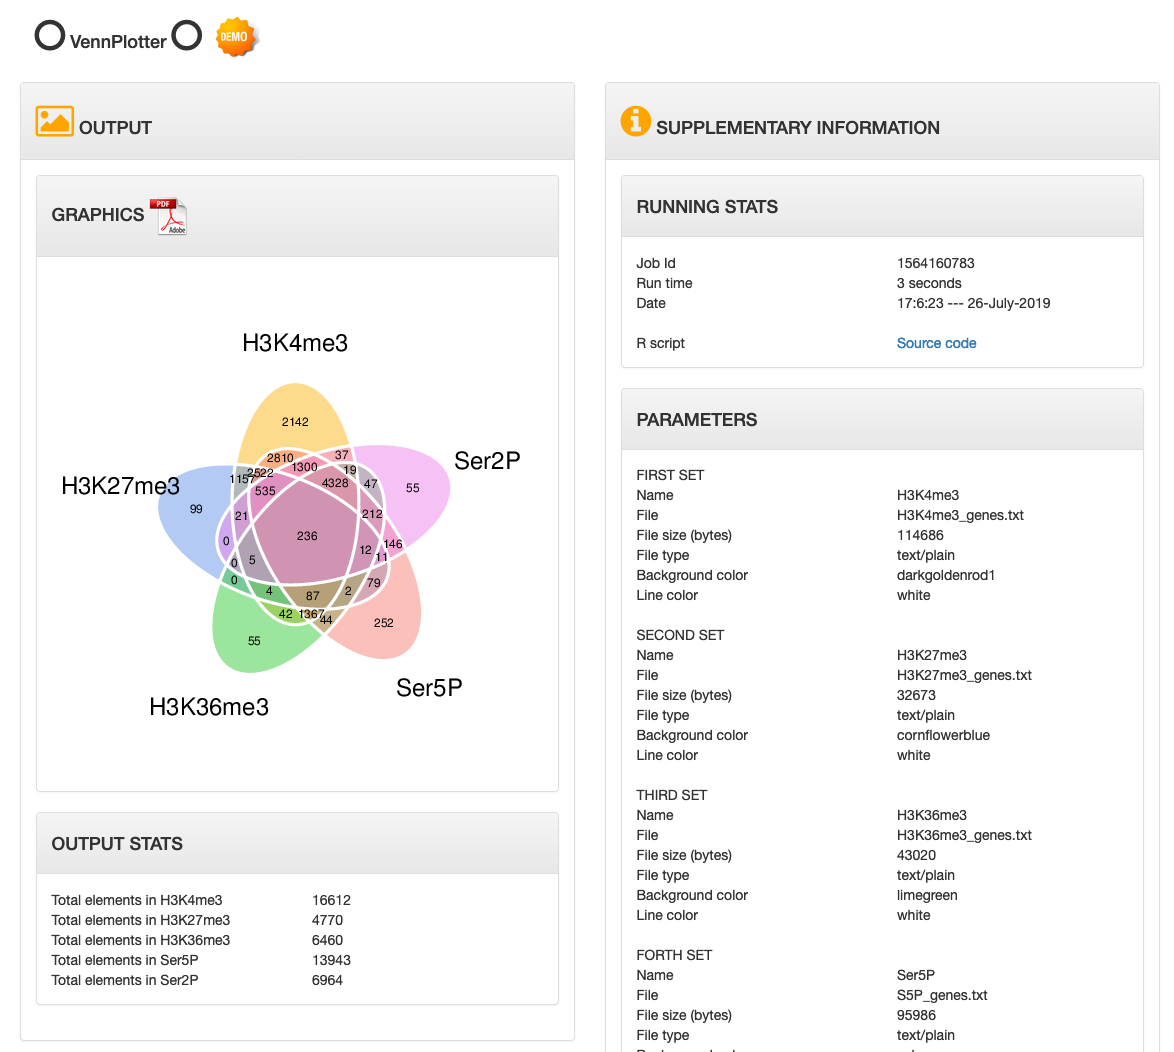
TUTORIAL 18. VennPlotter
Venn diagram that displays distinct overlapping subsets of target genes of H3K4me3, H3K27me3, H3K36me3 and RNA polymerase II modifications.
Access to the demo
Access to the demo
| INPUT | OUTPUT |
|---|---|
 |
 |
Regulatory Sets
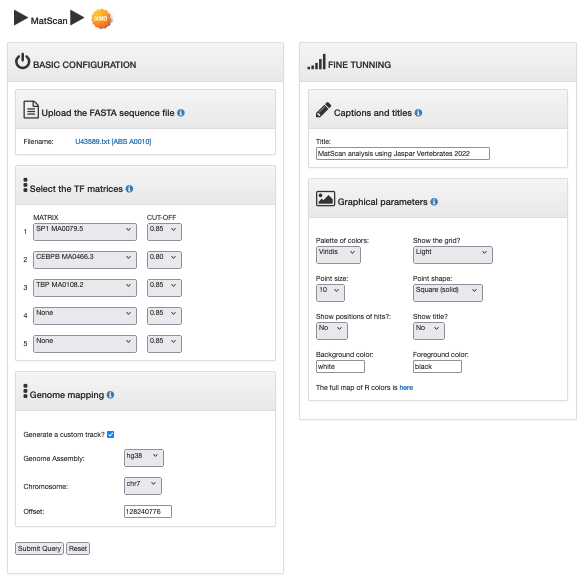
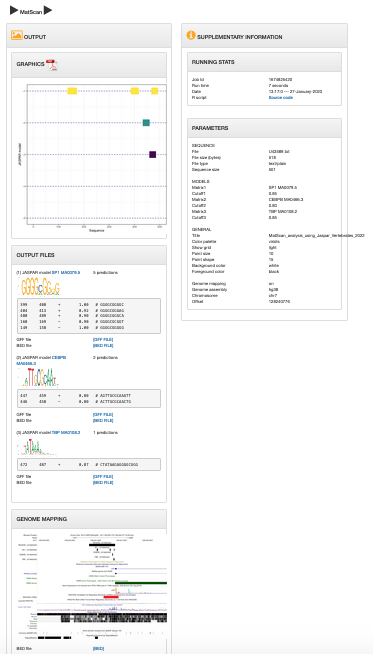
TUTORIAL 19. MatScan
Pattern matching scanning of a regulatory sequence using position weight matrices.
Access to the demo
Access to the demo
| INPUT | OUTPUT |
|---|---|
 |
 |
Data Sets
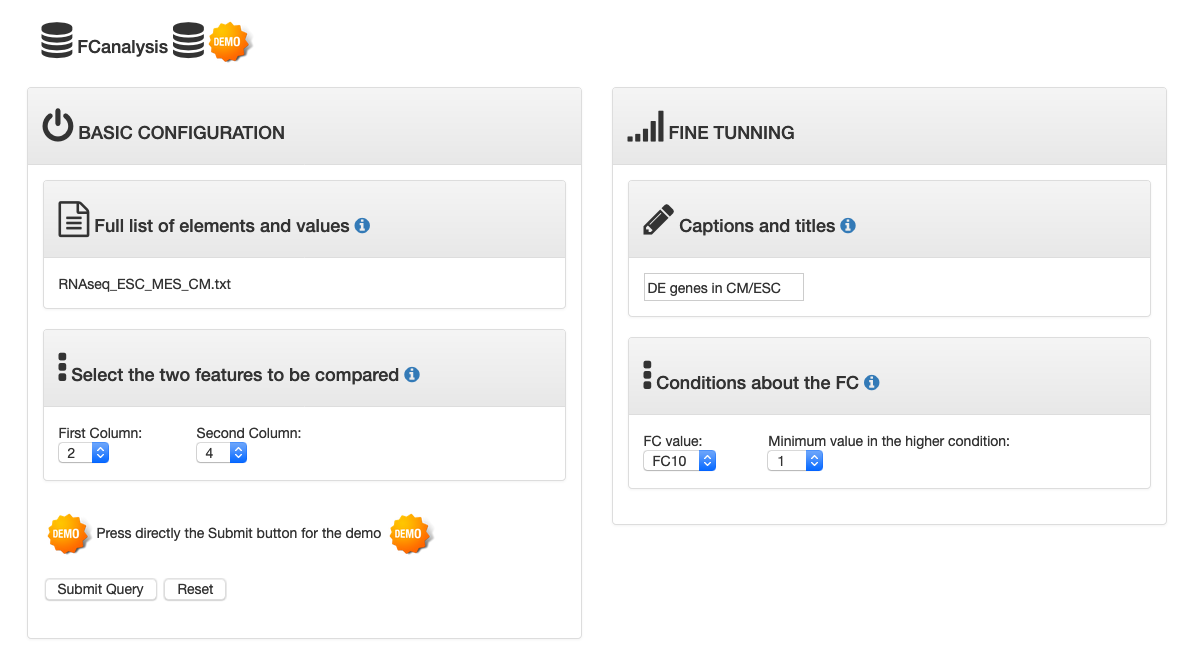
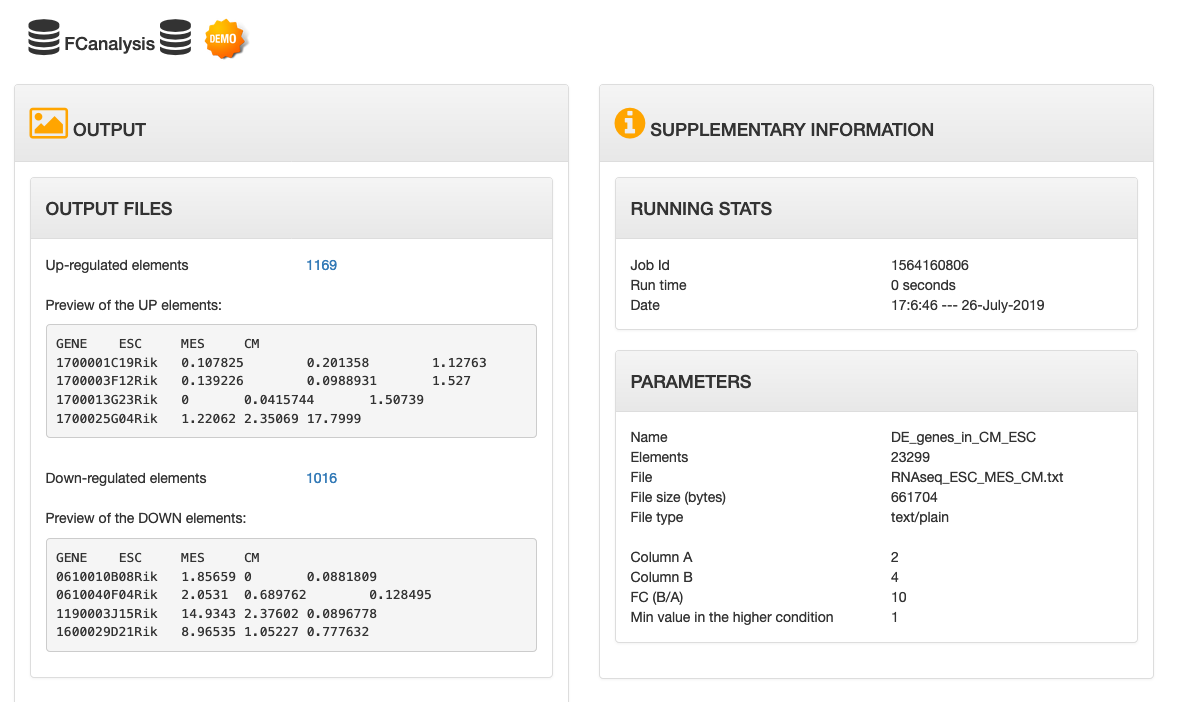
TUTORIAL 20. FCanalysis
Determination of the list of genes up- and down-regulated between ESC and cardiomyocytes (RNAseq expression).
Access to the demo
Access to the demo
| INPUT | OUTPUT |
|---|---|
 |
 |
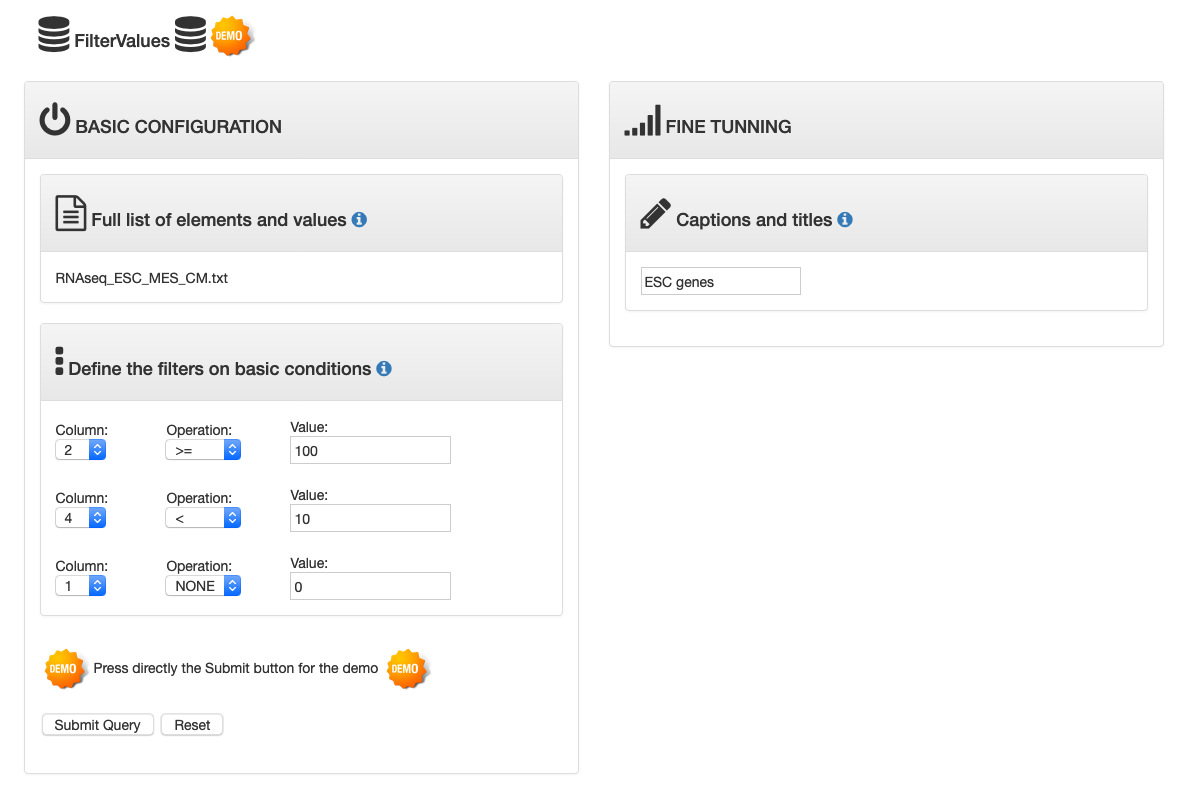
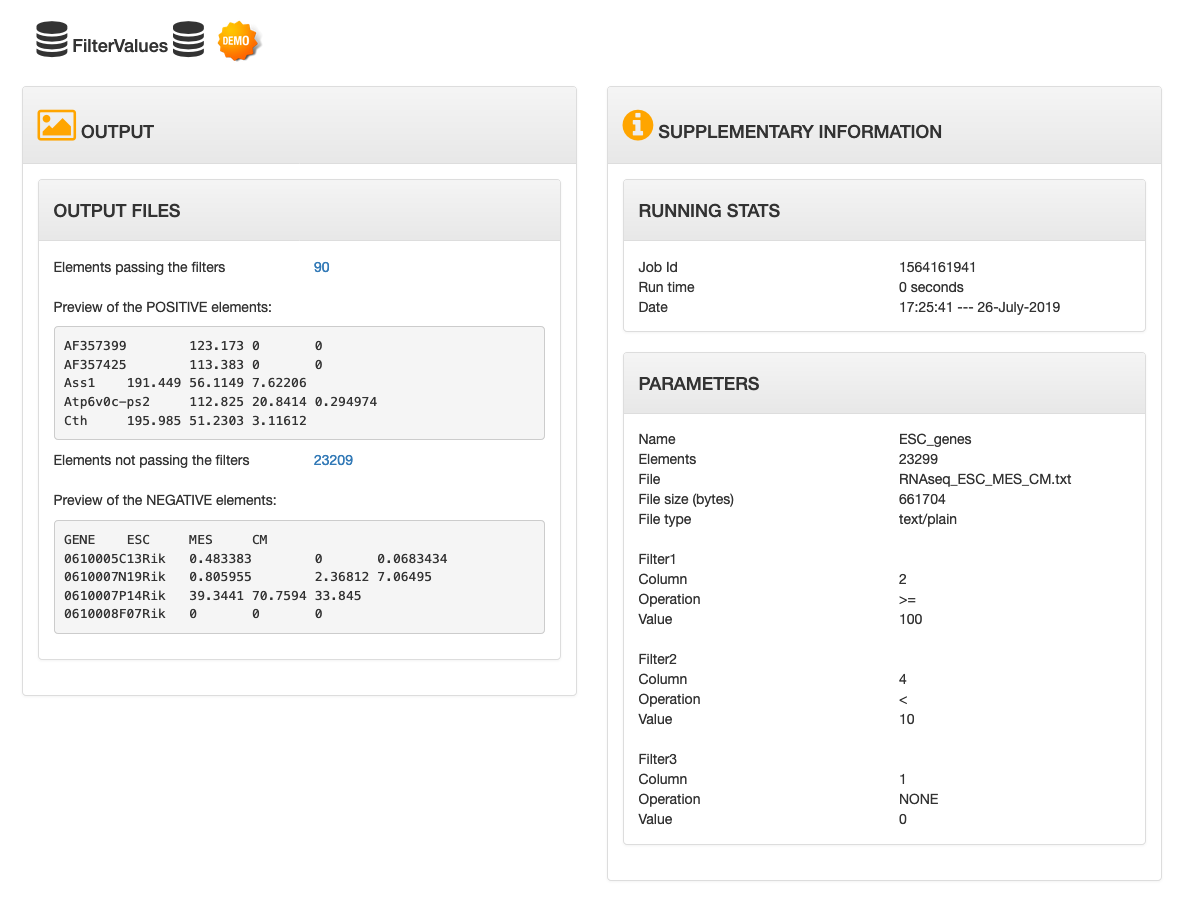
TUTORIAL 21. FilterValues
Looking for highly expressed genes in ESC that are moderately expressed in cardiomyocytes.
Access to the demo
Access to the demo
| INPUT | OUTPUT |
|---|---|
 |
 |
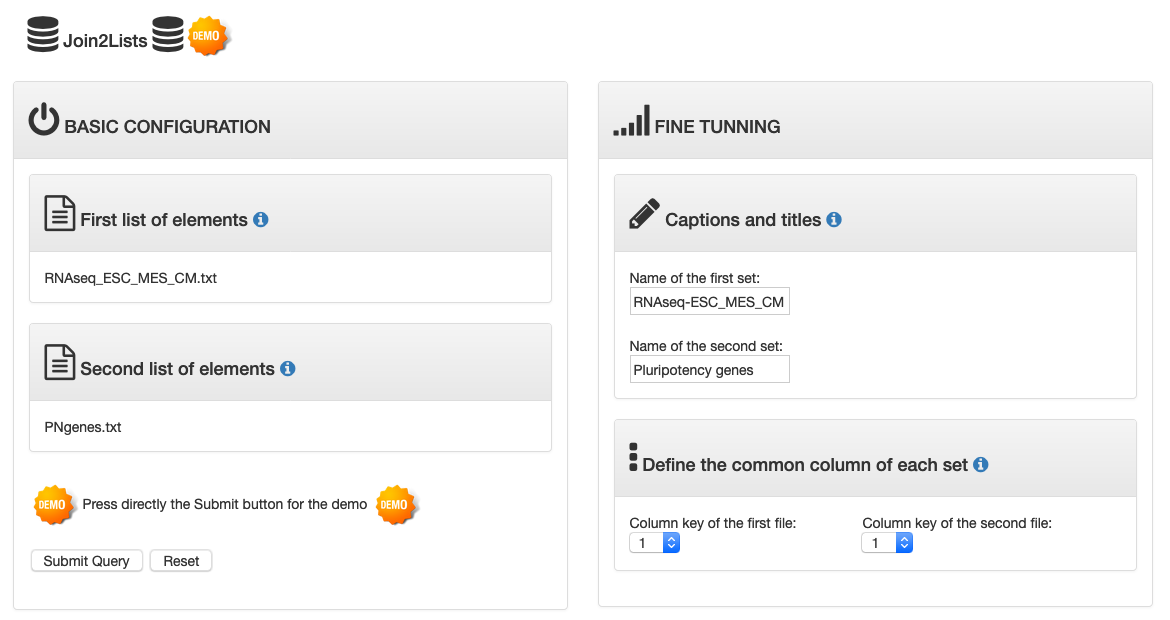
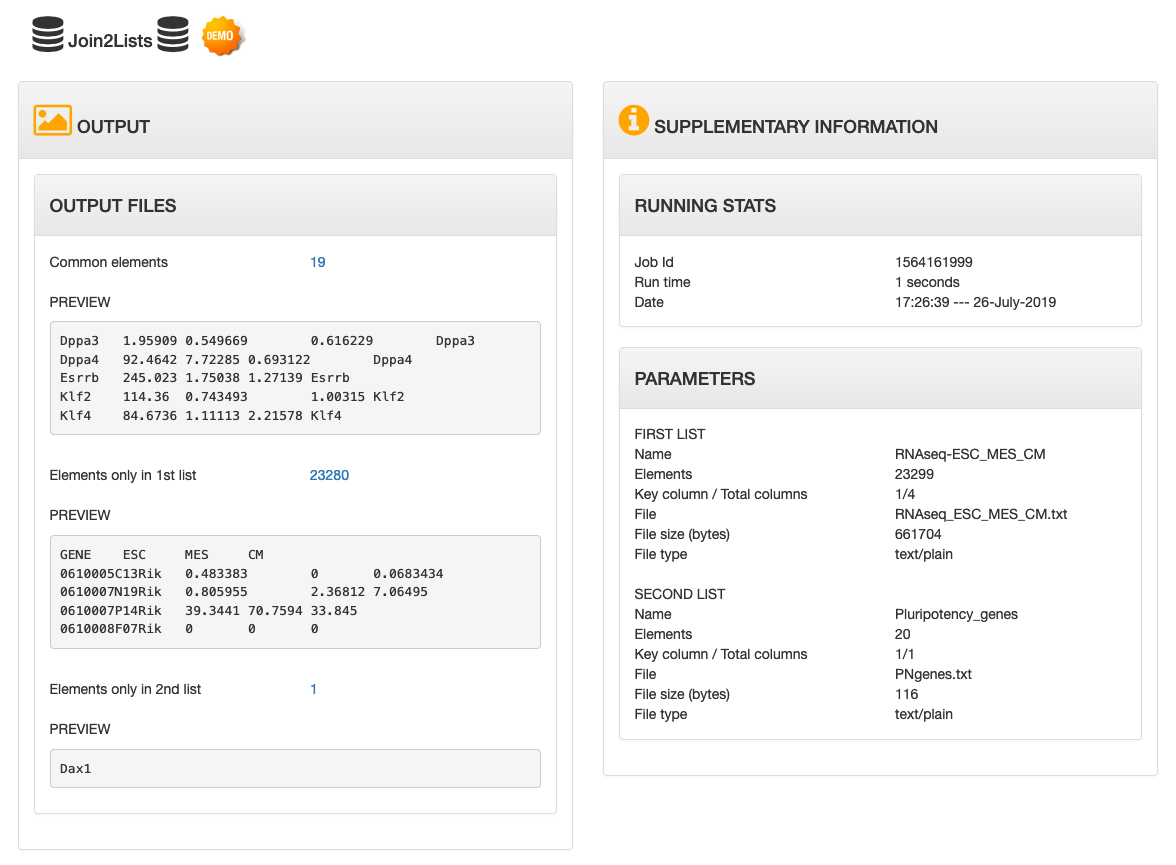
TUTORIAL 22. Join2Lists
Using the file of expression values for all the genes in the mouse genome, extract the values for a subset of genes.
Access to the demo
Access to the demo
| INPUT | OUTPUT |
|---|---|
 |
 |